Figure 2.
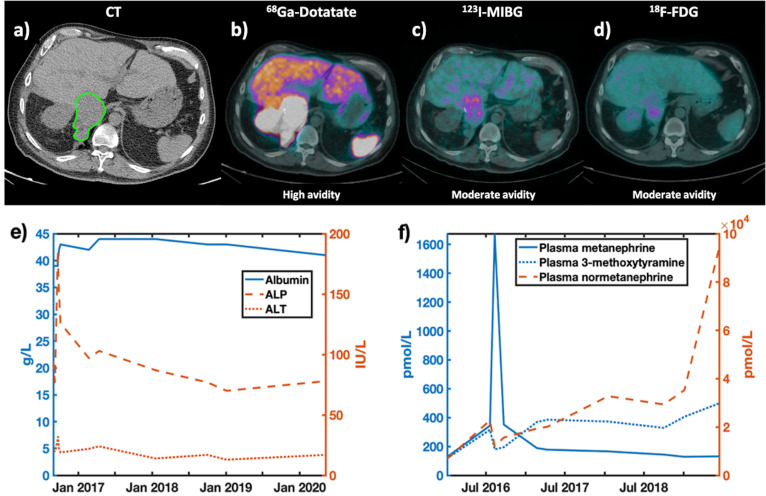
CT(a) and PET(b-d) imaging demonstrating the location of the pheochromocytoma. PET tracers included: b)68Gallium Dotatate, c) Iobenguane (MIBG), d) 18F-fluorodeoxyglucose (18FDG-PET). A qualitative assessment of tracer avidity is provided below each PET image. e) Blood albumin, ALP and ALT levels, as well as f) results for plasma metanephrine levels, showing levels of metanephrine, 3-methoxytyramine and normetanephrine are shown. These factors were considered to track disease stage.

