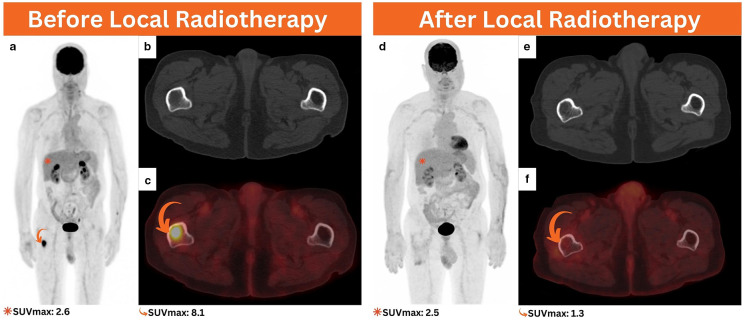
Figure 3.
Follow-up 18F-FDG PET/CT performed after the initial chemoradiation for response assessment, MIP (a), axial CT (b), and axial PET/CT (c) revealed evidence of a small intramedullary hypermetabolic focus involving the subtrochanteric region of the right femur without significant osseous abnormality on the axial CT images (curved arrows). 3 months following local radiation treatment, 18F-FDG PET/CT was performed for response assessment, MIP (d), axial CT (e), and axial PET/CT (f) denoted evidence of a complete metabolic response in the irradiated region (curved arrow). 18F-FDG PET/CT, 18-fluorine fludeoxyglucose positron emission tomography/CT; MIP, maximum intensity projection.

