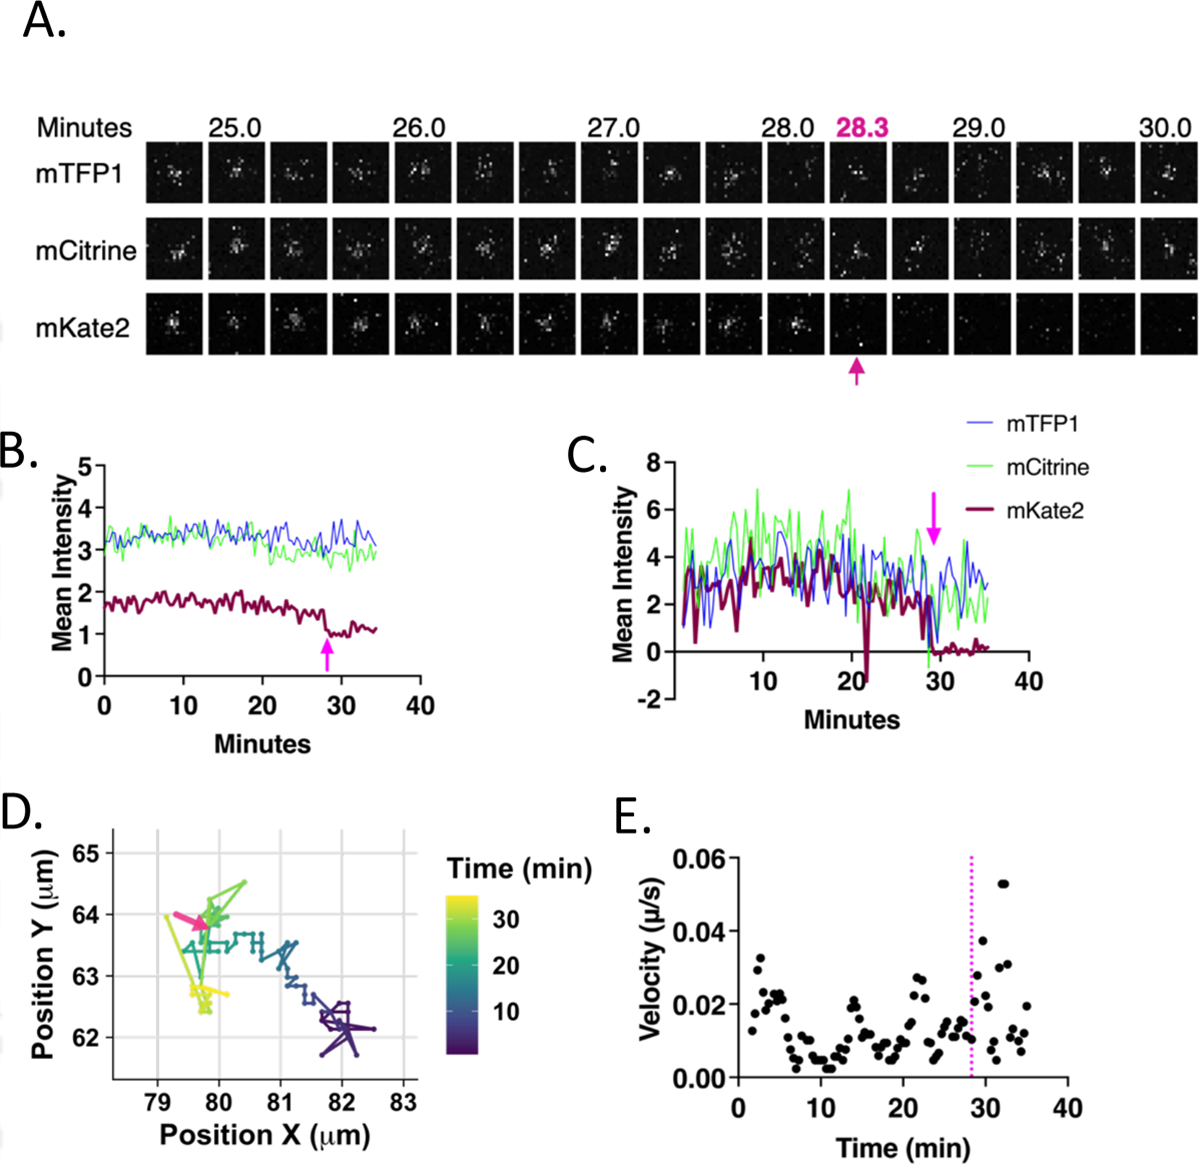
Figure 2. Progression of an individual example virus particle from the start of imaging to fusion and beyond simultaneously observed with three fluorescence channels.

A. Images of the particle in the mTFP1 (494–511nm) (top), mCitrine (521–538nm) (middle), and mKate2 (593–741nm) (bottom) channels. Images are 20s apart and the track is cropped to 10 frames before and 5 frames after fusion. The size of each image is 2.94 × 2.94 μm, centered around the particle centroid determined by tracking. In all images the arrow indicates the time at which fusion ends. B. Raw extracted intensity from a 2.942 μm2 box surrounding the particle centroid and plotted over time. C. Background subtracted intensity using a 1.96 μm diameter inner circle with an outer 0.28 μm diameter annular region from which the mean intensity was calculated and subtracted from the intensity of the inner region. D. Path of the particle over time within a boxed region from the total field of view. The color of the line represents time according to the scale on the right. The arrow indicates the position of the particle at the time that fusion is completed. E. Velocity was calculated by taking the distance between the localization of the particles at adjacent points in time and multiplying by the frame rate (1/20s). A 3-frame (one minute) rolling average of the velocities was taken and plotted as a function of time. The dotted line indicates the time at which fusion is completed.
