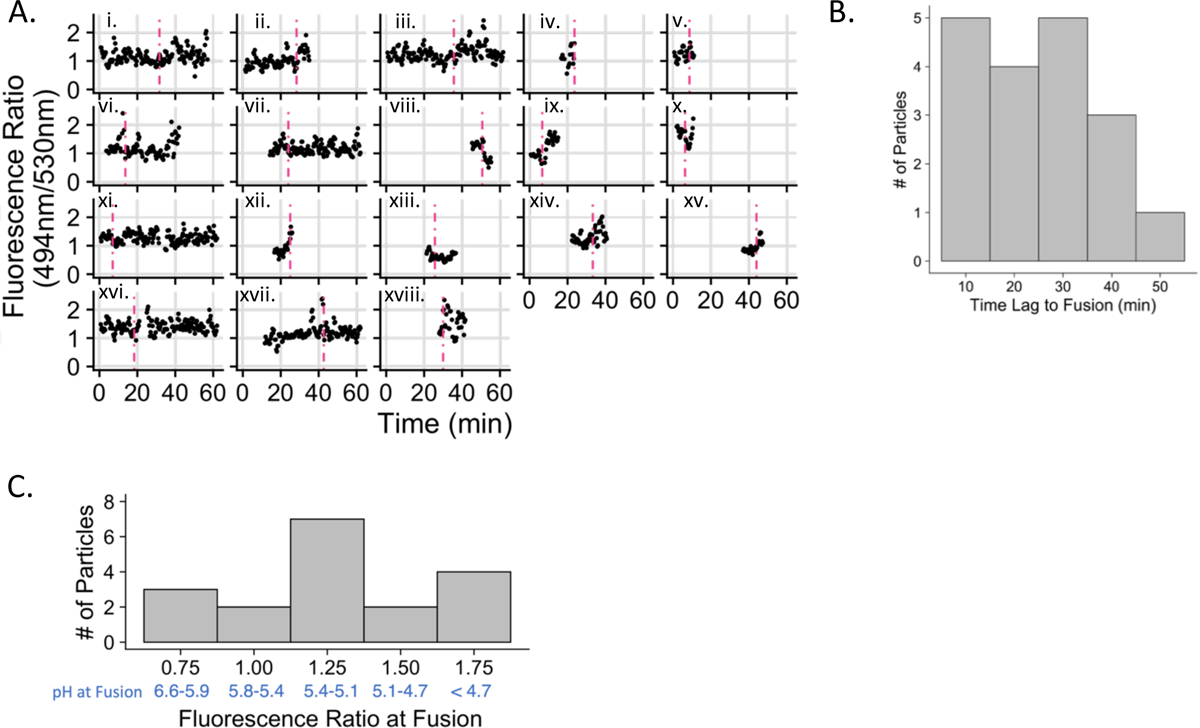
Figure 3. Kinetics and pH characteristics of VSV-G mediated viral particle trafficking and fusion.

A. Fluorescence emission intensity ratio plotted over time for all particles that fuse. The dashed vertical line represents the time of fusion as determined by the spreading or disappearance of the mKate2 signal. B. Frequency histogram of the time from the beginning of imaging to the time at which fusion occurs. C. Frequency histogram of the 494nm/530nm emission intensity ratios at the time of fusion using a six-frame moving average. The pH range falling within each histogram bin is shown in blue; fluorescence ratios were converted to pH range using the calibration curve (shown in Figure 1C). 18 fusion events were analyzed (out of 88 particles meeting the criteria described in the Materials and Methods) and are represented here (n=18).
