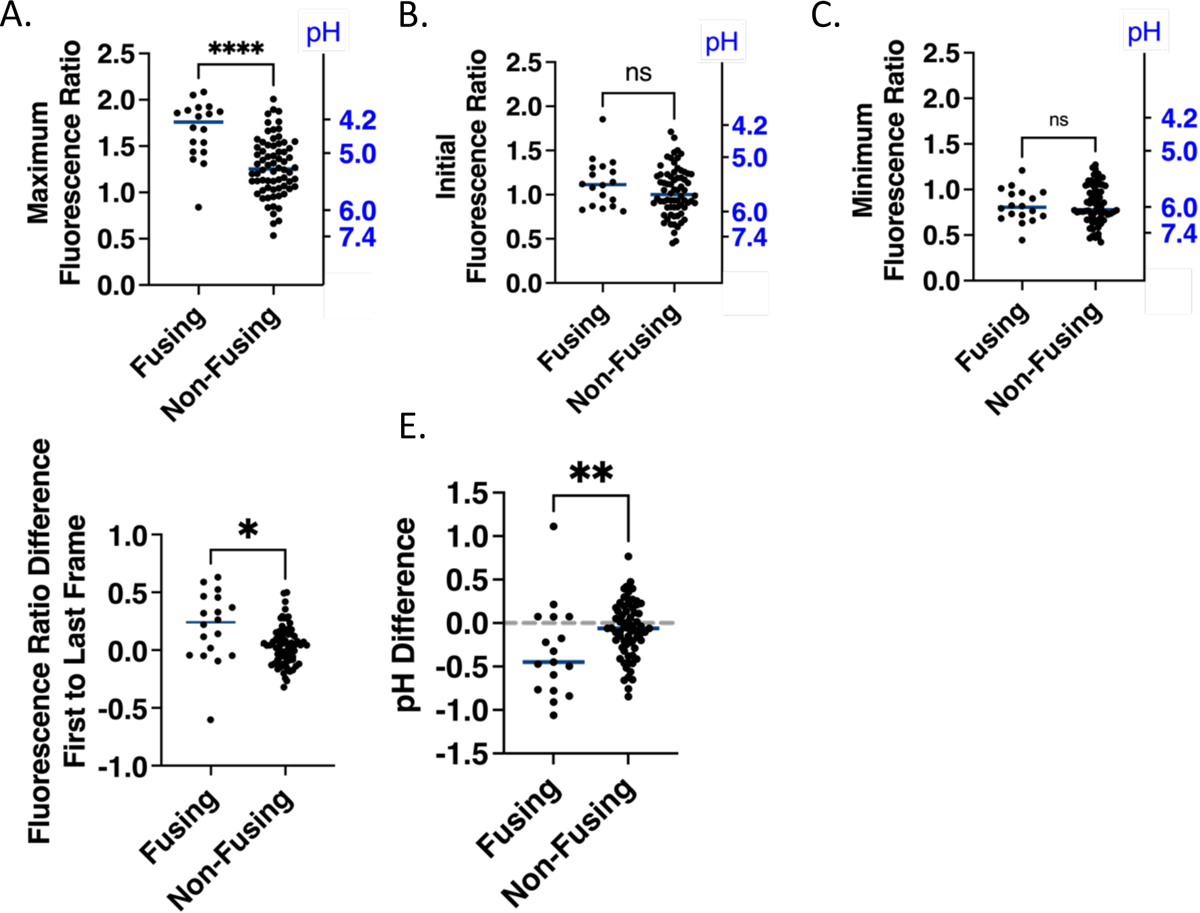
Figure 4. Fusion permissive and fusion non-permissive endosomes exhibit different extents of acidification.

A. Maximum emission intensity ratios (494nm/530nm) achieved in tracks based on a six-frame rolling average for fusion permissive and fusion non-permissive endosomes. The right Y axis displays reference pH values. (Note that the relationship between pH and ratio is not linear; see Figure 1C). All selected particles were non-overlapping with other particles, had apparent diameters less than ~1.5 μm, and were triple labelled. Non-fusing particles are from experiments, in which fusion events were observed in other locations. B. Initial emission intensity ratios over the first 6 observable frames for fusion permissive and fusion non-permissive endosomes. C. Minimum emission intensity ratios in tracks based on a six-frame rolling average for fusion permissive and fusion non-permissive endosomes. D. Difference between emission intensity ratios at the time at which the particle is first observable (start) and the time at which the pH sensor from the particle is last observable (end) for fusion permissive and fusion non-permissive endosomes. E. The initial and final emission intensity ratios from panel D converted to pH using the fit of the calibration curve (Figure 1C) and plotted as pH differences over the observable time for fusion permissive and fusion non-permissive endosomes. No change in pH is indicated with a horizontal dashed line. In all panels, points represent the values for individual particles and horizontal lines represent the median value of each group. Numbers of fusing particles and non-fusing particles are n=18 and n=70, respectively. A Mann-Whitney test (non-parametric assumption) was used to assess the significance of the differences in the distribution of fluorescence ratio values (A-D) or pH (E) (p<0.05 = *, p<0.01 =**, p<0.0001=****, ns, not significant). In E, observations where the initial and final values fell above or below the lower and upper limits of the calibration curve fit were excluded from analysis and the numbers are n=17 for fusing and n=68 for non-fusing particles.
