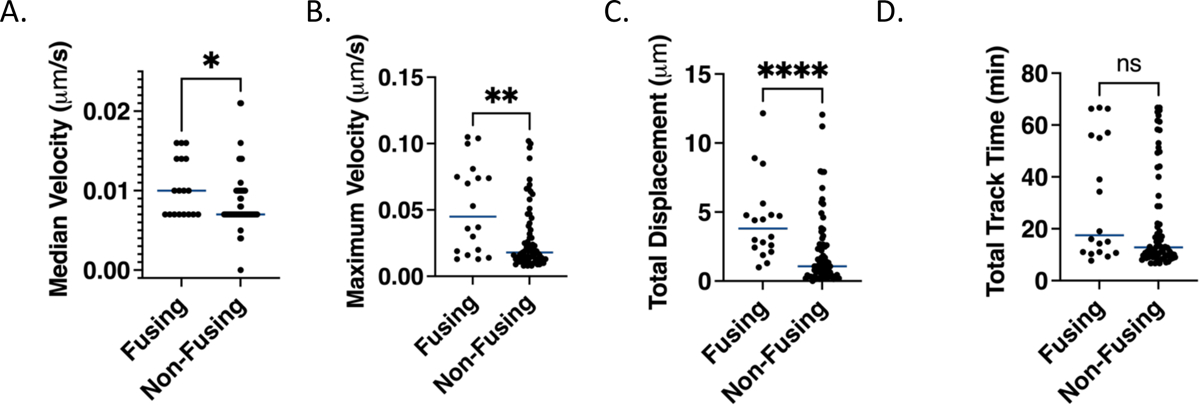
Figure 5. Fusion permissive endosomes have higher maximum velocities and travel further than fusion non-permissive endosomes.

A. Median velocities from all segments in a given track for fusion permissive and fusion non-permissive endosomes. The median value for each endosome is calculated based on a 3-frame (1 minute) rolling average of the velocities of all segments in a given track. B. Maximum velocities determined as the highest velocity of for any segment based on a 3-frame rolling average as in A for fusion permissive and fusion non-permissive endosomes. C. Total displacements calculated from the distance between the coordinate points at which the FRET sensor signal is first and last observed for fusion permissive and fusion non-permissive endosomes. D. Total track lengths, i.e. times that the FRET sensor signal was observable calculated as the time difference between when particles are first and last observed for fusion permissive and fusion non-permissive endosomes. In all panels, points represent the values for individual particles and the horizontal lines represent the medians. A Mann-Whitney test (non-parametric assumption) was used to assess the significance of the differences in the distribution of all values (p<0.05 = *, p<0.01 =**, p<0.0001=****, ns, not significant).
