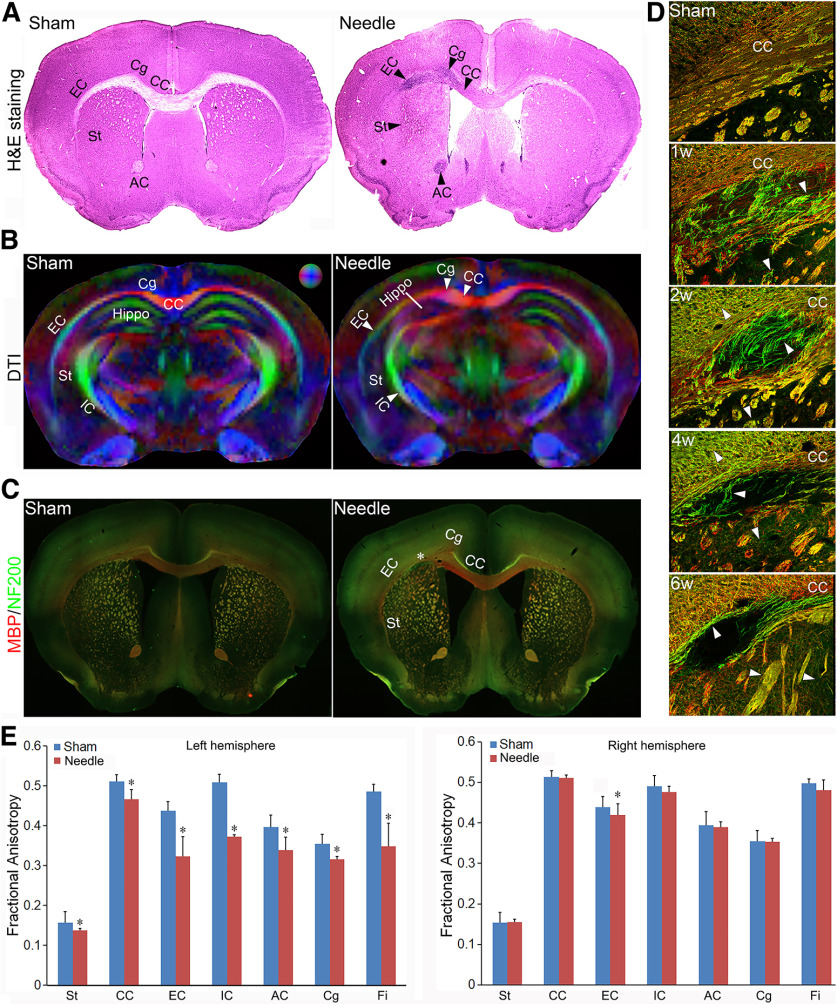
Figure 2.
WMI in the needle ABCS mode. A, Representative H&E staining of brain slices in sham and needle mice six weeks after surgery. Black arrowheads denote cell death in the CC, EC, IC, St, and AC in the left hemisphere in needle mice. B, directionally encoded color (DEC) map of ex vivo DTI six weeks after surgery. The color sphere represents the directionality of the principal axis of diffusion (red = left/right, green = dorsal/ventral, and blue = rostral/caudal). White arrowheads denote anisotropy reduction in the left CC, Cg, EC, IC, St, and Hippo. C, Representative MBP (red) and NF200 (green) staining in sham and needle mice six weeks after surgery (4×). Star represents microinfarct area. D, Representative MBP (red) and NF200 (green) staining (200×) in left CC at different time points after needle surgery. White arrowheads denote axonal demyelination. E, Quantitative analysis of FA in sham and needle mice. FA data in the CC, EC, IC, St, Hippo, Cg, and Fi for both the left and right hemispheres in sham and needle mice were quantitatively measured using DSI Studio and analyzed using one-way ANOVA. Data were expressed as mean ± SEM, n = 3 for sham, n = 5 for needle mice, * represents p < 0.05 versus sham.

