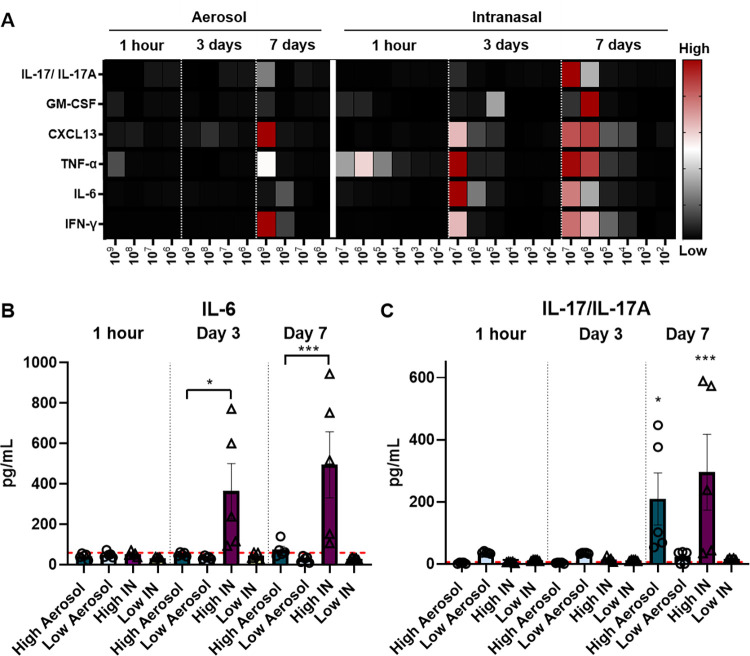
Fig 6. High dose intranasal challenge (UT25Sm1) leads to a significant increase in cytokine responses compared to aerosol challenge.
The dose is shown on the x-axis. Values are in pg/mL on the y-axis. A) Heat map of cytokines measured in the lung supernatant at 1 hour, day 3, and day 7 post-challenge. A) IL-6 and B) IL-17/IL-17A represented as pg/mL. The p-values were calculated using ANOVA followed by a Tukey’s multiple-comparison test, * p < 0.05 and *** p < 0.001 (n = 5 per group). Stars represent comparison to baseline unless otherwise indicated. Error bars are mean ± SEM values.

