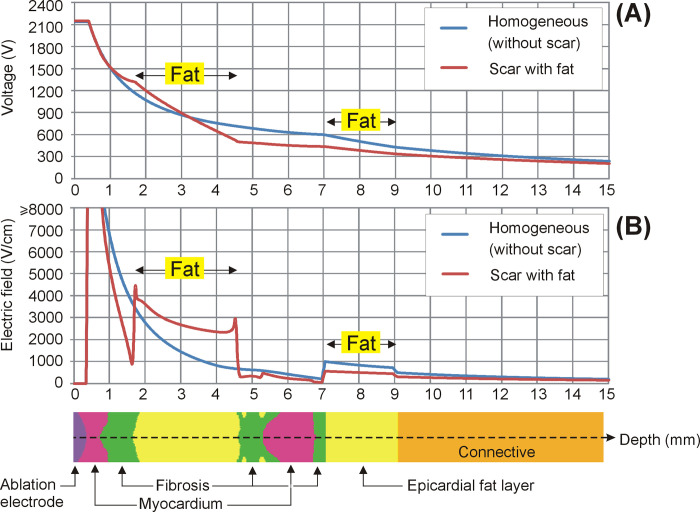
Fig 7.
Variation of voltage (A) and electric field (B) along the axis under the electrode, from the tissue surface (0 mm, inside the electrode) to a depth of 15 mm, for two ventricular walls: homogeneous myocardium (i.e. without scar), and scar with fat deposition. Note that the voltage drop (i.e. how fast it falls along the axis) is greater across the less conductive tissue (fat), which results in electric field values even higher than those in tissues closer to the ablation electrode (myocardium and fibrosis).

