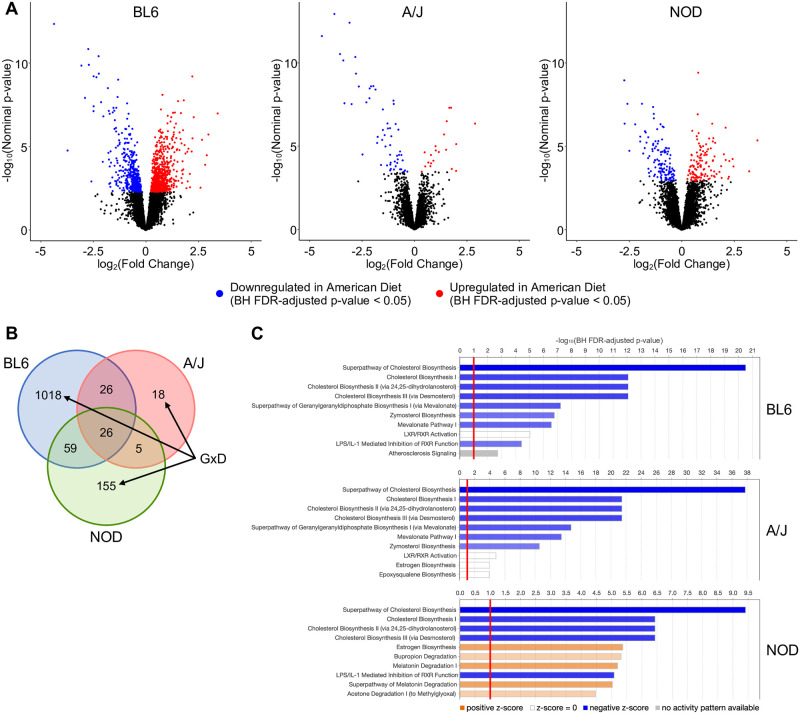
Fig 2. Gene-by-diet interactions of hepatic gene expression in BL6, A/J, and NOD mice.
(A) Volcano plots of liver gene expression indicating significantly upregulated (red) and downregulated (blue) genes from the American vs. standard diet comparison of BL6, A/J, and NOD, as determined by the BH FDR-adjusted p-value. (B) Venn diagram of overlap between strains of differentially expressed genes (DEGs) upon American diet exposure. Marked categories are strain-specific, highlighting potential gene-by-diet interactions. (C) IPA results showing enriched pathways among diet DEGs (American vs. standard diet) for each strain; the top 10 most significantly enriched pathways with BH FDR-adjusted p-values < 0.1 are shown.

