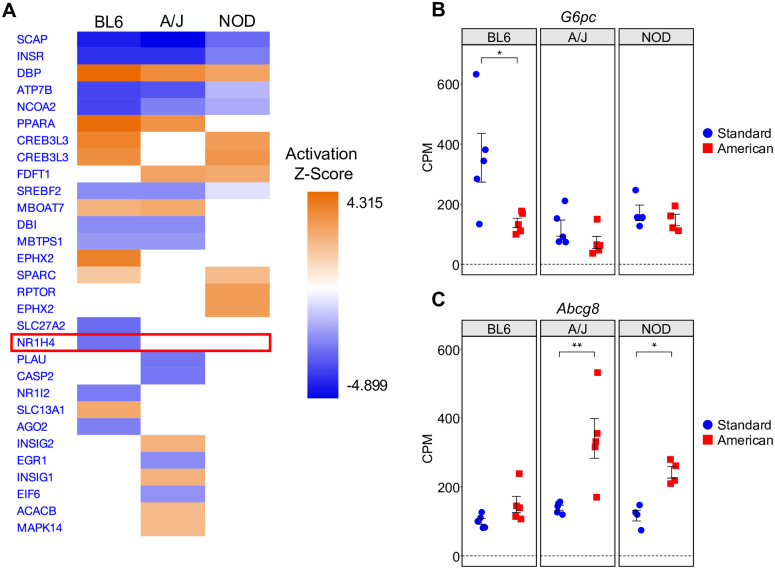
Fig 3. Regulatory network analysis identifies ubiquitous and strain-specific transcriptional regulators of diet response.
(A) Output of IPA regulatory network analysis identifying both common and strain-specific master upstream transcriptional regulators predicted based on diet DEGs (American vs. standard diet) in BL6, A/J, and NOD. The top 30 master upstream regulators ranked by z-score are shown. FXR (Nr1h4) is highlighted. (B) Plot of G6pc gene expression in BL6, A/J, and NOD mice on the standard and American diets. (C) Plot of Abcg8 gene expression in BL6, A/J, and NOD mice on the standard and American diets. The y-axes represent counts per million (CPM) of each gene. Error bars represent SE. * p < 0.05, ** p < 0.01, *** p < 0.001 from RNA-seq BH FDR-adjusted p-values.

