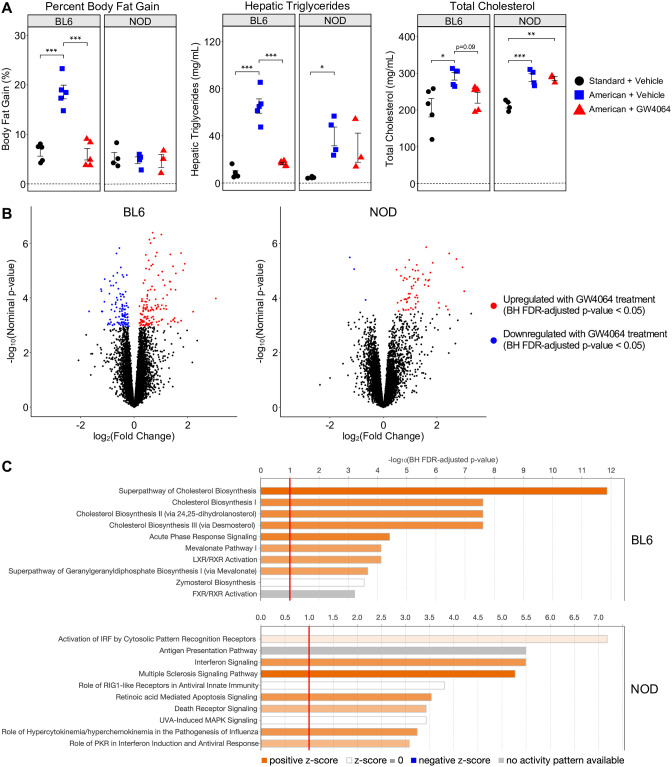
Fig 4. FXR agonist GW4064 elicits strain-specific responses in BL6 and NOD mice on the American diet.
(A) Phenotypic measurements of BL6 and NOD mice under three conditions tested (standard diet + vehicle, American diet + vehicle, American diet + GW4064). Phenotypes shown are percent body fat gain (left), hepatic triglyceride levels (middle), and total cholesterol (right). Error bars represent SE. * p < 0.05, ** p < 0.01, *** p < 0.001 from ANOVA between means within strains, with post-hoc Tukey HSD test. (B) Volcano plots of liver gene expression indicating significantly upregulated (red) and downregulated (blue) genes from the American diet + GW4064 vs. American diet + vehicle comparison of BL6 and NOD, as determined by the BH FDR-adjusted p-value. (C) IPA results showing enriched pathways among drug DEGs (American diet + GW4064 vs. American diet + vehicle) for each strain; the top 10 most significantly enriched pathways with BH FDR-adjusted p-values < 0.1 are shown.

