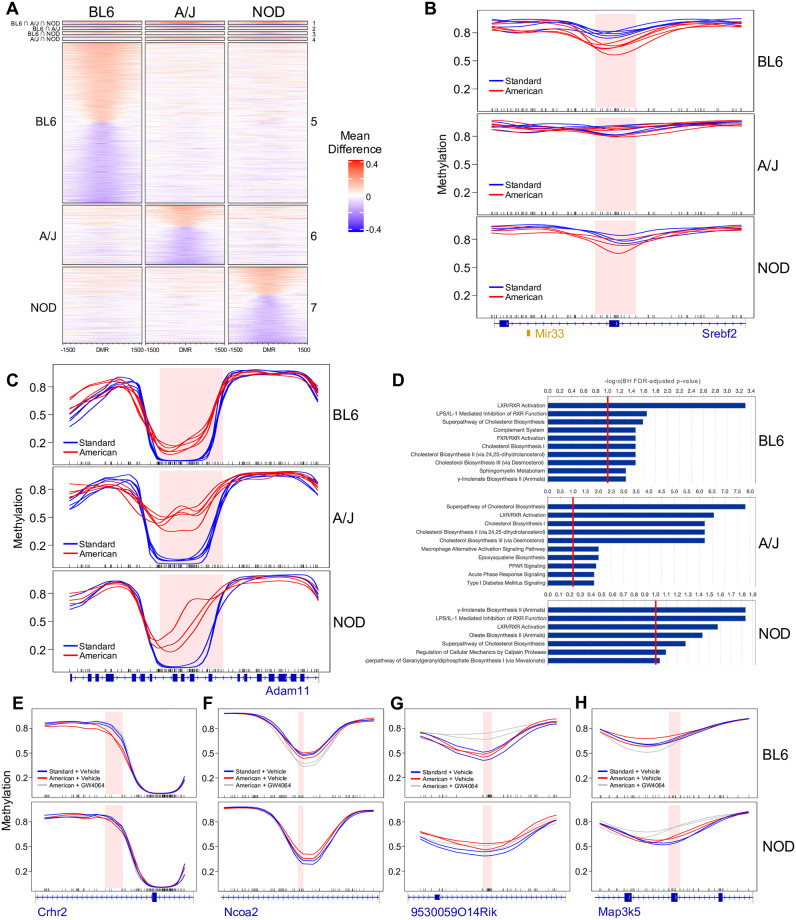
Fig 5. Gene-by-diet interactions in hepatic DNA methylation of BL6, A/J, and NOD mice.
(A) Heatmap of mean methylation differences between diets across a 3-kb window centered around the 1,316 diet DMRs, with each row corresponding to a single DMR. The x-axis represents the genomic distance of each locus relative to the center of the DMR and the color gradient represents the mean methylation difference between the American vs. standard diet at each locus. DMRs are further grouped by strain specificity, with group numbers shown to the right of the heatmap. DMRs in group 1 are nominally significant and have a dietary mean difference > 10% in all three strains; groups 2 through 7 denote DMRs which are nominally significant and have a mean difference > 10% in only one or two strains. (B) Example of a strain-specific diet DMR, showing the BL6-specific hypomethylation of Srebf2 and Mir33 upon exposure to the American diet. (C) Example of a strain-agnostic diet DMR, showing the ubiquitous hypermethylation of Adam11 upon exposure to the American diet. (D) IPA results showing enriched pathways among diet DMR-associated genes (American vs. standard diet) for each strain; the top 10 most enriched pathways with BH FDR-adjusted p-values < 0.1 are shown. (E-H) Examples of four distinct categories of diet- and drug-associated DMRs overlapping phenotypically relevant genes functionally implicated in various metabolic (E-G) or inflammatory (H) pathways.

