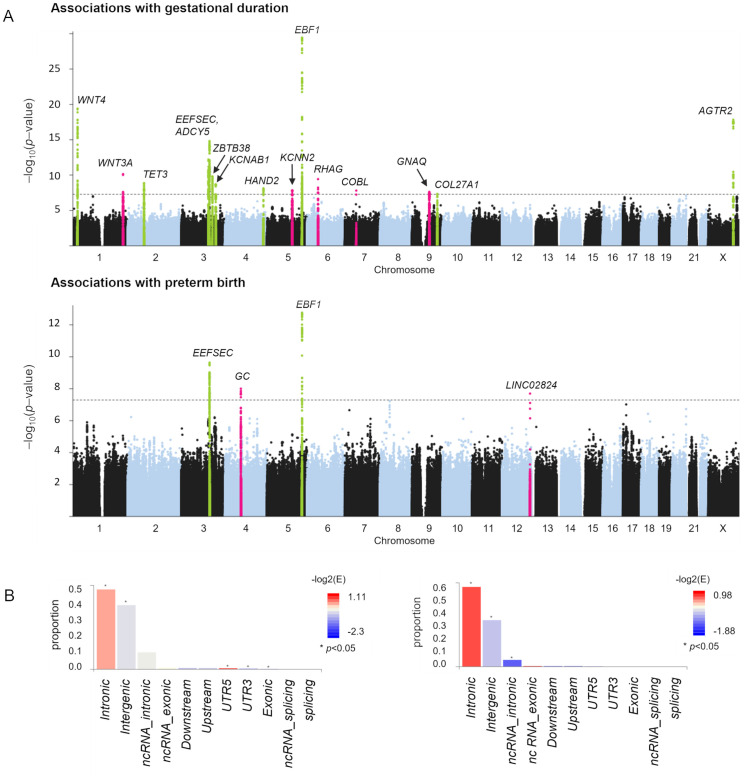
Fig 1. Meta-analysis of gestational duration and SPTB.
A: Loci with genome-wide significant associations (p<5×10⁻⁸) are highlighted in the Manhattan plots. Chromosomal positions are shown at the x-axis, and the y-axis shows association p values at the –log10 scale. The meta-analysis detected 15 loci associated with gestational duration and four loci associated with SPTB. Peaks highlighted in pink represent novel loci, and peaks highlighted in green show known loci B: Annotations as number of SNPs per functional consequences on genes in the analysis of gestational duration (on the left) and preterm birth (on the right). Bars are colored by –log2(enrichment) relative to all variants in the reference panel.

