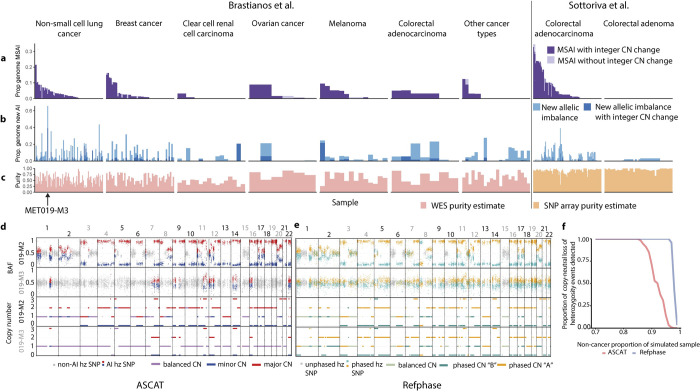
Fig 4. Low cancer cell fraction SCNA detection and cohort-level analysis for the Sottoriva et al. [46] and Brastianos et al. [47] cohorts.
a) Barplots showing the proportion of the genome affected by MSAI in each tumour sample in the pan-cancer cohort grouped by tumour type. b) Barplots showing the proportion of the genome with allelic imbalance that was identified using multi-sample reference phasing and that was previously undetected using ASCAT. Each tumour sample in the pan-cancer cohort is arranged by tumour type. Light blue bars represent the proportion of the genome in each sample affected by previously undetected allelic imbalance that did not result in an alteration in the previously estimated integer allele-specific copy number. Dark blue bars represent instances in which newly detected allelic imbalance that resulted in new integer copy number state being estimated. c) Barplots representing the estimated cancer cell fraction of each sample in the pan-cancer cohort grouped by cancer type. d) Unphased BAF and integer copy number states across the genome from two samples analysed using ASCAT. e) Phased BAF and haplotype-specific copy number states across the genome from two samples analysed using Refphase. f) Line plot showing the proportion of simulated copy-neutral loss of heterozygosity events identified at differing non-cancer proportions of a sample using ASCAT (red) or Refphase (blue).

