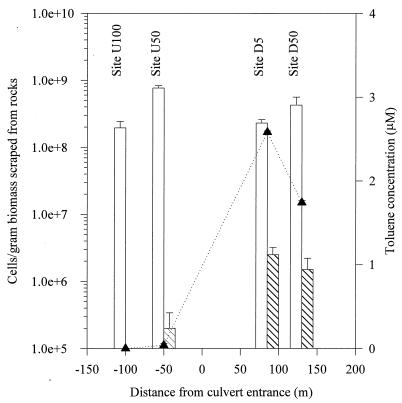
FIG. 2.
Bacterial counts (sampled on 7 September 1993) and toluene levels (sampled on 19 September 1993) along the East Drainage Ditch. Error bars represent standard deviations of duplicate samples. □, viable count of heterotrophic bacteria on 1% PTYG plates incubated at 20°C for up to 4 weeks in the dark. ▧, plate count of toluene-degrading bacteria on minimal salts agar with 110 μM toluene. Incubations were performed at 20°C for up to 4 weeks in the dark. ▴, toluene concentration.

