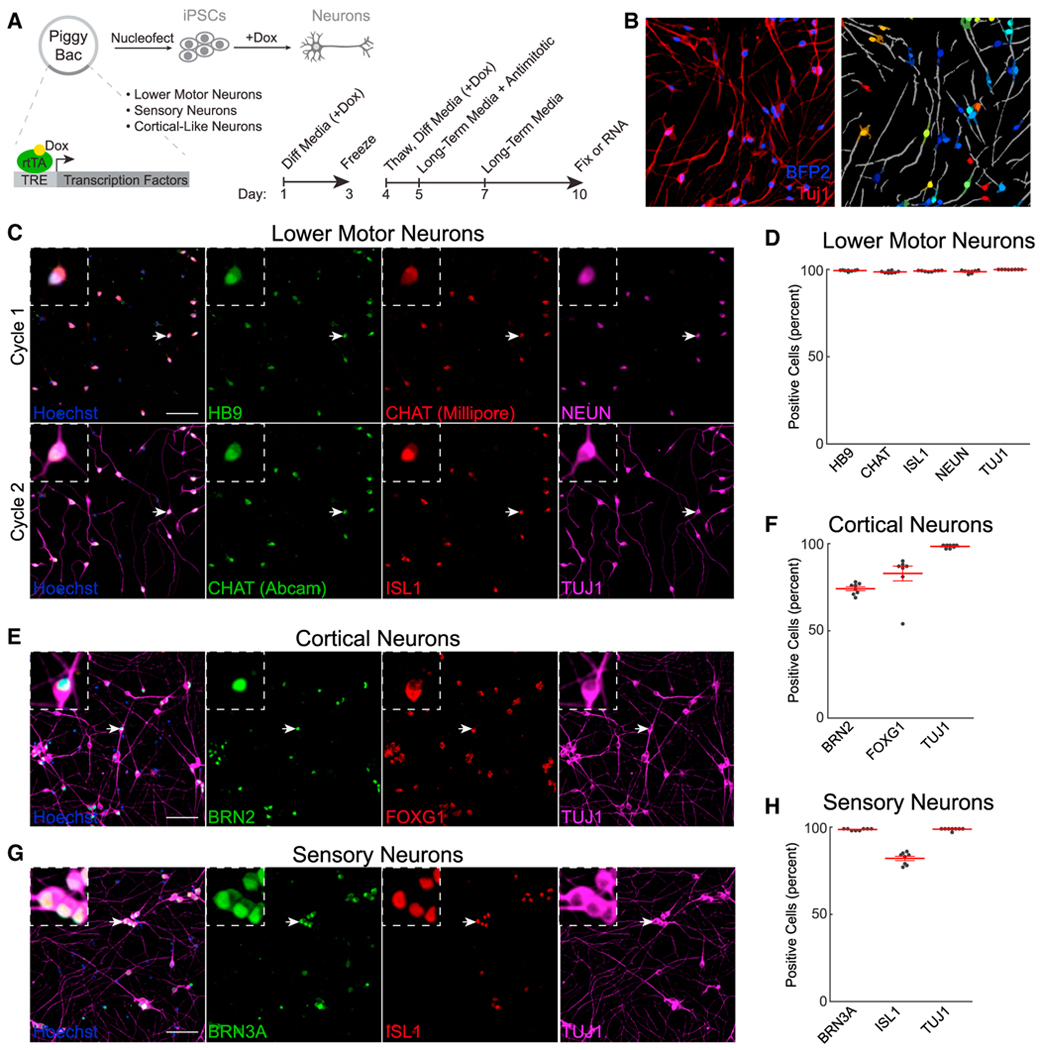
Figure 1. Differentiation of LMNs, cortical neurons, and sensory neurons.

(A) Schematic for tet-inducible differentiation. Timeline summarizes the differentiation protocol.
(B) Masking of neurons using BFP2 and TUJ1. Lighter, darker, and gray colors indicate nuclei, cytoplasm, and neurites, respectively.
(C–H) Immunofluorescence and quantification of LMNs (C and D), cortical neurons (E and F), and sensory neurons (G and H). Scale bars: 100 μM; n = 8 wells for all groups. Arrows indicate magnified cells in insets.
