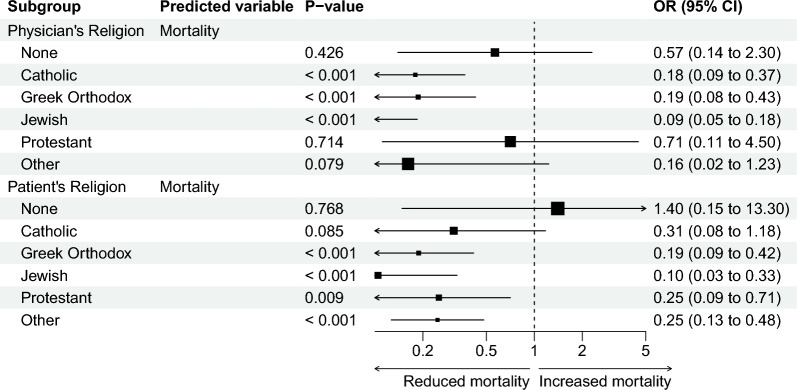
Fig. 2.
Forest plot from the general estimating equation (GEE) model estimates showing the changes in odds ratios (OR) from Ethicus-1 to Ethicus-2 in the odds of patient mortality with respect to different physician and patient religious affiliations. P values indicate the statistical significance of change for each religion factor when compared to the model’s intercept. Confidence intervals (CI) at 95% from the estimate indicate lower and upper limits of the changes. The size of squares positioned at fold-change estimates are proportional to the size of the corresponding standard errors. Changes in odds ratios for physician and patient religious affiliations are estimated from separate models. The fold-change estimates are based on the models in Tables S6–S7

