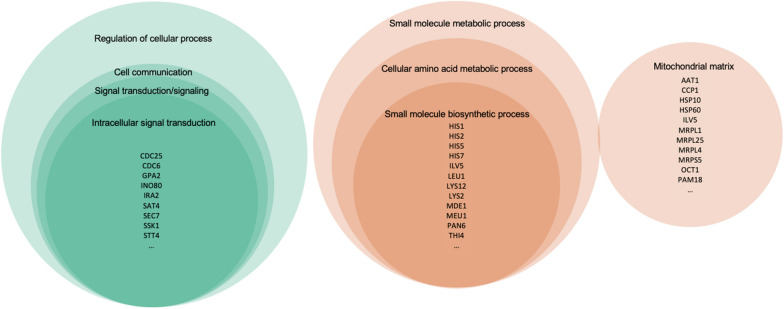
Fig. 9.
Diagrams of the overlapping DEGs contributing to the 9 enriched GO terms shared by the MHT&CK, SHT&CK, and SHT&MHT comparisons and their intersections. Color represents gene clustering based on the expression patterns: green for Cluster-1 and orange for Cluster-2. The size of intersection areas between circles is proportional to the number of overlapping DEGs. Core genes are listed for the three GO terms with the fewest overlapping contributing DEGs

