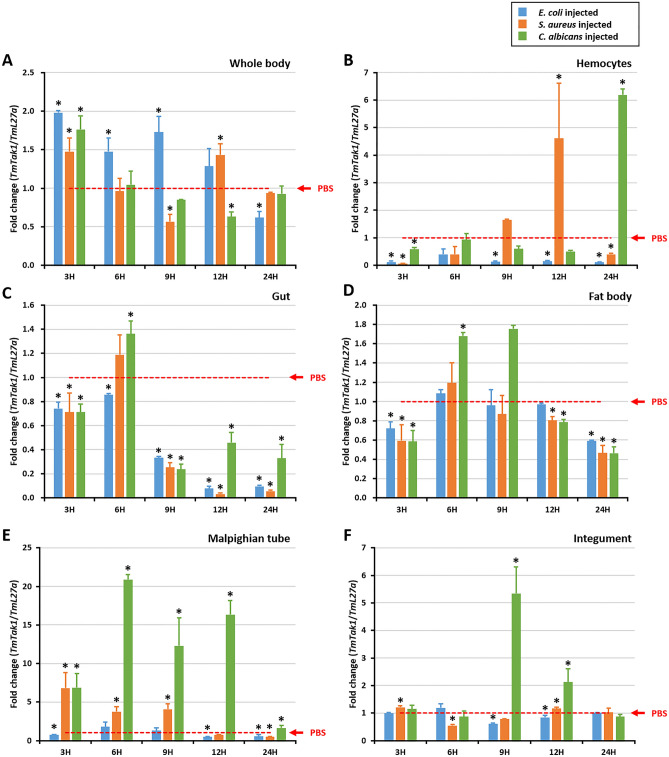
Figure 2.
TmTak1 mRNA expression profiles after microbial challenge. Expression of TmTak1 mRNA in the whole body (A), hemocytes (B), gut (C), fat bodies (D), Malpighian tubules (E), integument (F) of larvae infected with Escherichia coli, Staphylococcus aureus, and Candida albicans. The expression was analyzed by qPCR using L27a (T. molitor) as the internal control. For each time point, the expression level in the phosphate-buffered saline (PBS)-injected control (mock control) was set to 1; this is represented by a dotted line. vertical bars represent mean ± standard error from three biological replicates.

