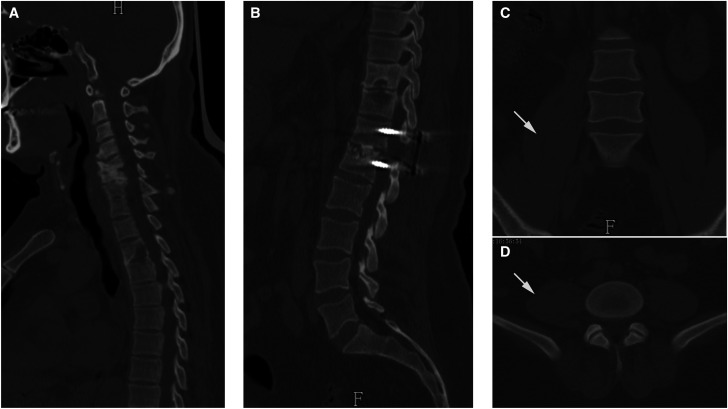
Figure 3.
CT images at 12-month follow-up. (A and B) Sagittal CT images suggest the bony destruction improved in the C5, C6, T3, T10, T12, and L1 vertebrae, and bony fusion was achieved between the T12 and L1 vertebrae. (C and D) Coronal and axial CT scans indicate that the psoas abscess was cured (white arrows). CT = computed tomography.

