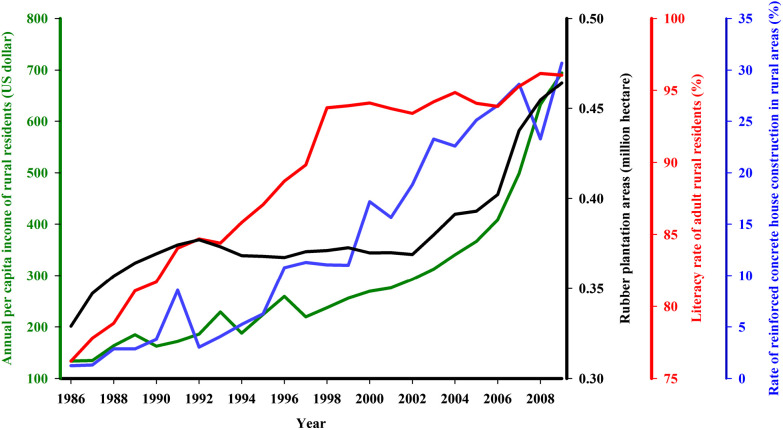
Figure 6.
Socioeconomic developments on Hainan Island, 1986–2009. The left Y-axis represents the annual per capita income of rural residents (APCI, green line). The three right Y-axes, from left to right, represent the rubber plantation areas (RPA, black line), rubber being the major cash crop in the malaria-endemic area of Hainan Island; the literacy rate of adult rural residents (LRR, red line); and the rate of reinforced concrete house construction in rural areas (RRC, blue line), respectively.

