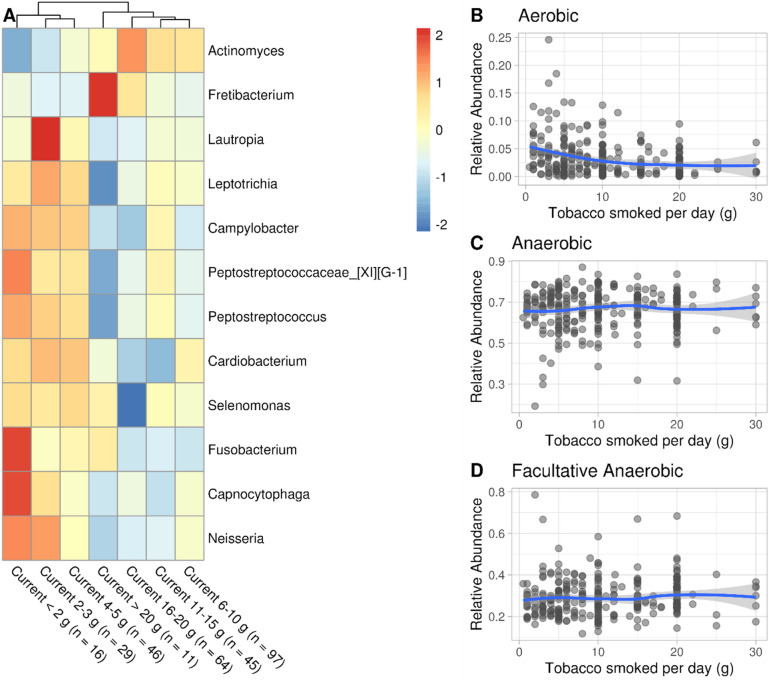
Figure 2.
Smokers’ (n = 308) daily smoking intensity is associated with relative abundance shifts of several genera and a decrease of aerobic taxa relative abundance. (A) Heatmap of genera significantly affected by daily smoking intensity. Genera were transformed to relative abundance and Z-score scaled to highlight relative differences in mean abundance in relation to the smoking intensity. Significant genera (Benjamini–Hochberg q-value < 0.05, FDR = 5%) were obtained modeling each genus in response to daily smoking intensity as multiples of 5 g per day as a semi-continuous variable, adjusting for age (continuous), sex and number of teeth in the DESeq2 negative binomial generalized linear model framework. (B, C, D) Relative abundance of aerobes, anaerobes and facultative anaerobes, respectively, in relation to the grams of tobacco smoked daily.

