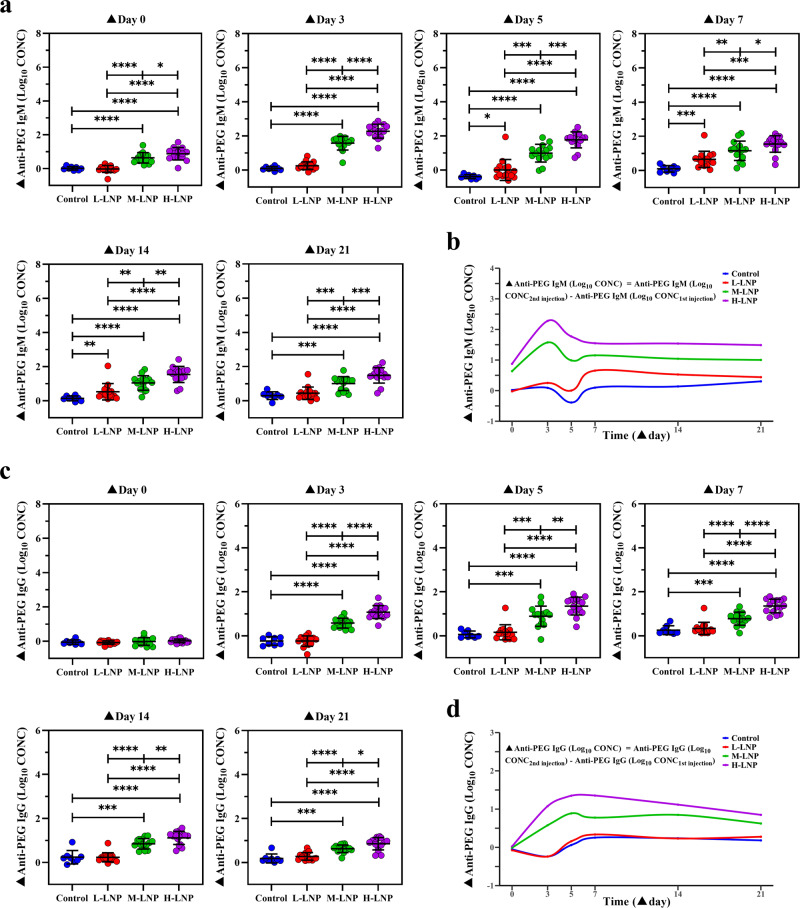
Fig. 4. Enhanced production of anti-PEG antibodies in rat by repeated administration with PEGylated LNP.
a Enhanced anti-PEG IgM production induced by repeated LNP injection. ▲Anti-PEG IgM (Log10 CONC) means Anti-PEG IgM (Log10 CONC2nd injection) (log10-transformed concentration of anti-PEG IgM induced during the second injection cycle) subtracted corresponding Anti-PEG IgM (Log10 CONC1st injection) (log10-transformed concentrations of anti-PEG IgM induced during the first injection cycle). Peak levels of ▲Anti-PEG IgM (Log10 CONC) induced by different LNP doses were 0.654 ± 0.471 for L-LNP (▲Day 7), 1.574 ± 0.399 for M-LNP (▲Day 3) and 2.277 ± 0.410 for H-LNP (Day 3), respectively, with significant difference among three groups (P < 0.001 for M-LNP vs L-LNP; P < 0.0001 for H-LNP vs L-LNP; P < 0.0001 for H-LNP vs M-LNP). b Time-course of enhanced anti-PEG IgM induced by repeated injection of LNP. c Enhanced anti-PEG IgG production induced by repeated injection of LNP. ▲Anti-PEG IgG (Log10 CONC) means Anti-PEG IgG (Log10 CONC2nd injection) (log10-transformed concentration of anti-PEG IgG induced during the second injection cycle) subtracted corresponding Anti-PEG IgG (Log10 CONC1st injection) (log10-transformed concentrations of anti-PEG IgG induced during the first injection cycle). Peak levels of ▲Anti-PEG IgG (Log10 CONC) induced by different LNP doses were 0.888 ± 0.459 for M-LNP (▲Day 5) and 1.354 ± 0.308 for H-LNP (▲Day 7), respectively, with significant difference between these two groups (P < 0.01). d Time-course of enhanced anti-PEG IgG induced by repeated injection of LNP. In (a) and (c), data were presented as “mean ± standard deviation”, with n = 8 for Control group and n = 15 for all LNP-treated groups. Differences in ▲Anti-PEG IgM (Log10 CONC) or ▲Anti-PEG IgG (Log10 CONC) among various groups were analyzed using Mann–Whitney U test, with P values adjusted for FDR (false discovery rate). *P < 0.05; **P < 0.01; ***P < 0.001; ****P < 0.0001. In (b) and (d), changing curves of average level of ▲Anti-PEG IgM (Log10 CONC) or ▲Anti-PEG IgG (Log10 CONC) over time for various doses were fitted by the R package called “ggalt”.

