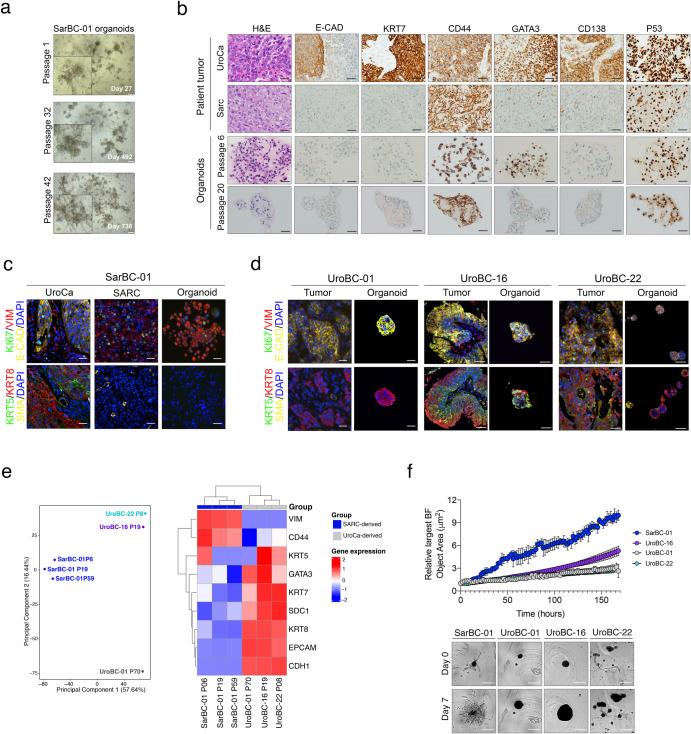
Fig. 2. Generation of a long-term in vitro model derived from a SARC patient, which displays mesenchymal and invasive properties.
a Representative bright field images of SarBC-01 organoids at passage 1 (27 days of culture), passage 32 (492 days of culture), and passage 42 (728 days of culture). Scale bars represent 200 μm. b Phenotypic analyses of the distinct tumor components (UroCa, SARC) and derived organoids at early and late passage (passage 6 and 20, respectively). Shown are representative H&E images and IHC staining for the indicated antibodies. Scale bars represent 50 μm. c, d Immunofluorescence analyses of SarBC-01 (c) and UroBC-01, UroBC-16, and UroBC-22 (d) tumor and organoids pairs. Shown are representative images for the indicated antibodies. Vim: Vimentin, E-cad: E-cadherin, SMA: Smooth Muscle Actin. DAPI: 4’,6-diamidino-2-phenylindole. Scale bars represent 50 μm. e Left panel: Principal Component Analysis (PCA) based on comparison of RNA-sequencing gene expression profiles of SarBC-01 organoids (passage 6, passage 19, passage 59), UroBC-01 (passage 70), UroBC-16 (passage 19), and UroBC-22 (passage 8). Right panel: Heatmap depicting unsupervised clustering analysis based on relative expression of selected epithelial- and mesenchymal-associated genes. f Top panel: Largest bright field object area measured over time for spheroids generated from SarBC-01 cells and UroBC-01 cells Analyses were performed using a mixed-effects analysis (P = 0.0001). Data are represented as means of three spheroids (relative to day 0 for each) and the error bars represent standard deviations (SD). Two independent biological replicates were performed and one representative replicate is shown. Bottom panel: representative images of SarBC-01 (passage 40), UroBC-01 (passage 39), UroBC-16 (passage 16), and UroBC-22 (passage 9) spheroids at day 0 and day 7 are shown. Scale bars represent 800 µm.

