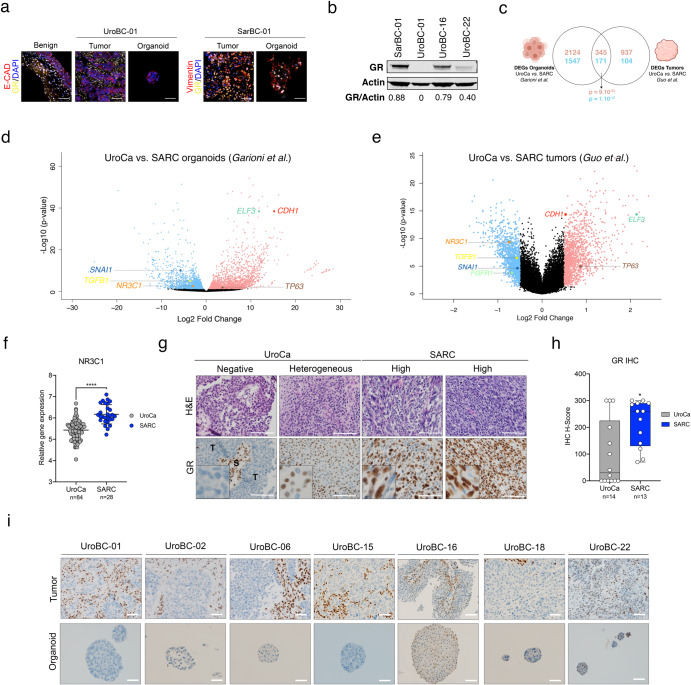
Fig. 4. Glucocorticoid Receptor (GR) is highly expressed in SARC.
a Immunofluorescence analyses of UroBC-01 (left) and SarBC-01 (right) tumor and organoids pairs. Shown are representative images for the indicated antibodies. GR glucocorticoid receptor, E-cad E-cadherin, Vim Vimentin, DAPI 4’,6-diamidino-2-phenylindole. Scale bars represent 50 μm. b Western blot analysis of GR expression in SarBC-01 (passage 73), UroBC-01 (passage 72), UroBC-16 (passage 18) and UroBC-22 (passage 8). c Venn diagram depicting differentially expressed genes in UroCa vs. SARC organoids and UroCa vs. SARC primary tissues. Numbers in red represent upregulated genes while numbers in blue represent downregulated genes. Overlaps’ P values of both upregulated and downregulated genes are shown. Statistical analysis was performed using a one-sided Fisher’s exact test. d Volcano plot depicting differential gene expression between UroCa organoids (n = 3) and SARC organoids (n = 3). Indicated are selected genes significantly negatively or positively enriched in UroCa models vs. SarBC-01. e Volcano plot depicting differential gene expression between UroCa tumors (n = 84) and SARC tumors (n = 28) as analyzed from the dataset of ref. 4. Indicated are selected genes significantly negatively or positively enriched in UroCa vs. SARC. f Expression of the NR3C1 gene in UroCa and SARC samples. Statistical analysis was performed using an unpaired t test (****P < 0.001). g Examples of H&E and immunohistochemical staining for GR in UroCa samples and SARC samples. S Stroma, T tumor. Scale bars represent 100 μm. h Box plot showing significant higher frequency of positivity and higher H-score for GR in SARC (n = 13) vs. UroCa (n = 14) samples (*P < 0.05 for frequency and expression, Fisher’s exact test and Mann–Whitney test, respectively). i Immunohistochemistry analyses of GR expression in tumor and paired organoids for seven UroCa samples. Scale bars represent 50 µm.

