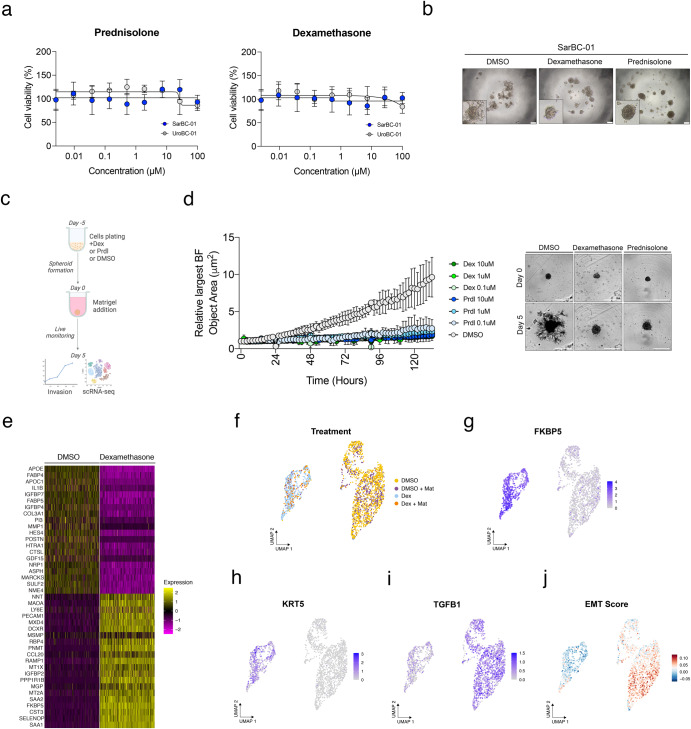
Fig. 5. Glucocorticoid treatment leads to morphological and transcriptomic changes associated with reversion of epithelial-to-mesenchymal transition.
a Glucocorticoids such as prednisolone and dexamethasone have no significant effect on the viability of SarBC-01 cells in dose response experiments. b Change of morphology of SarBC-01 upon treatment with 1 µM of dexamethasone or 1 µM of prednisolone. Scale bars represent 200 μm. c Schematic representation of the workflow followed for the in vitro invasion assay and single-cell RNA sequencing. d Left: Largest bright field object area measured over time for spheroids generated from SarBC-01 cells treated with three concentrations of dexamethasone (Dex) or prednisolone (Prdl) as compared to the DMSO control. Analyses were performed using a mixed-effects analysis (P = 0.0001). Data are represented as means of three spheroids (relative to day 0 for each) and the error bars represent standard deviations (SD). Two independent biological replicates were performed and one representative replicate is shown. Right: Representative images of SarBC-01 spheroids treated with DMSO, 0.1 µM of dexamethasone or 0.1 µM of prednisolone at day 5 and day 10 are shown. Scale bars represent 800 µm. e Heatmap displaying top 20 up- and downregulated genes in dexamethasone- vs DMSO-treated SarBC-01 spheroids after random down-sampling of DMSO-treated condition. f–j Single-cell RNA sequencing of SarBC-01 cells (passage 52) following dexamethasone treatment. 2170 cells were analyzed following incubation with DMSO or dexamethasone in invasion assay conditions and in presence of absence of Matrigel, leading to four different culture conditions: DMSO: 1071 cells; DMSO + Mat: 501 cells; Dex: 442 cells; Dex + Mat: 156 cells. Shown are UMAP representations of the treatment conditions (f), expression of selected indicated genes (g–i) and aggregated EMT score (j).

