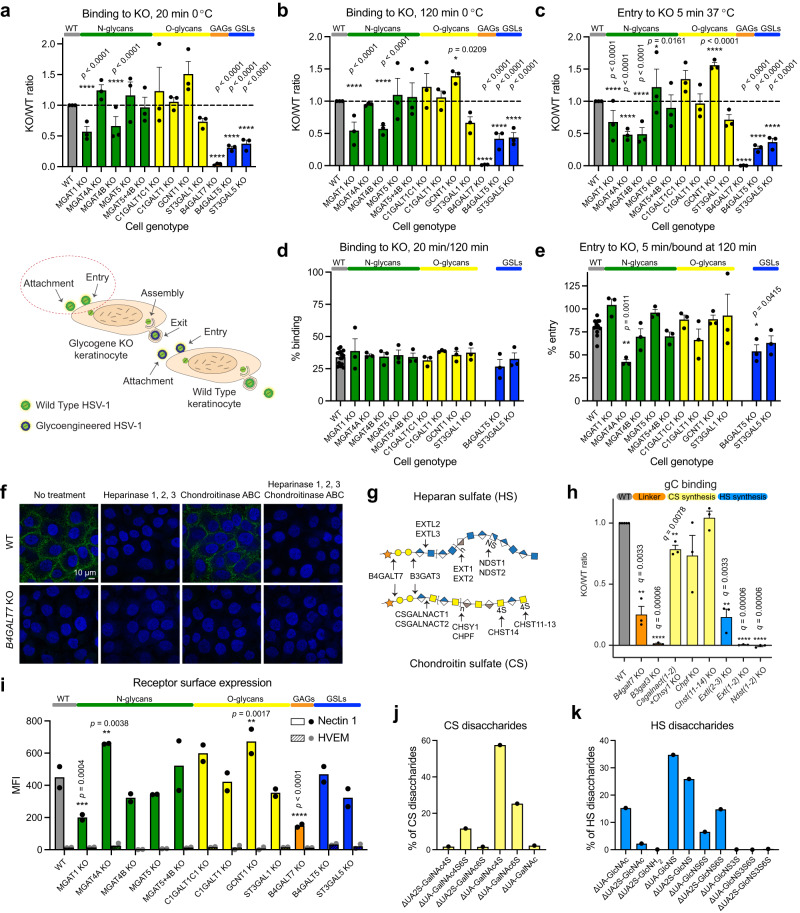
Fig. 2. Binding and entry of HSV-1 to mutant cell lines.
HSV-1 binding (20 min (a) or 120 min (b) on ice) and entry (5 min at 37 °C after 120 min on ice (c)) to KO cell lines. Data is shown as WT-normalized mean + SEM of 3 independent experiments for each KO cell line. Two-way ANOVA followed by Dunnett’s multiple comparison test was used on raw data to evaluate differences from WT (*p < 0.05, **p < 0.01, ***p < 0.001, ****p < 0.0001). Proportion of virus bound at 20 min compared to 120 min (d) or proportion of virus entered at 5 min compared to virus bound at 120 min (e) is shown as mean + SEM of 3 independent experiments for each KO cell line from a total of 15 experiments. One-way ANOVA followed by Dunnett’s multiple comparison test was used to evaluate differences from WT (*p < 0.05, **p < 0.01, ***p < 0.001, ****p < 0.0001). f HaCaT WT and B4GALT7 KO cells were probed for HSV-1 gC binding. Enzymatic treatments were included to evaluate contributions of HS and CS GAG chains. Representative of 2 independent experiments. g A simplified overview of GAG synthesis. h HSV-1 gC binding to a panel of CHO KO cell lines. Data is shown as WT-normalized geometrical means of 3 independent experiments for each KO cell line, and the bar heights indicate mean + SEM. One sample t test was used to evaluate differences from 1. FDR at 5% was controlled by two-stage step-up method of Benjamini, Krieger and Yekutieli (*q < 0.05, **q < 0.01, ***q < 0.001, ****q < 0.0001). i Nectin 1 and HVEM surface expression. Data points show background subtracted median fluorescence intensity (MFI) from two independent experiments, and the bar heights indicate the mean. j Percentages of total quantified CS disaccharides in HaCaT WT (Supplementary Table 2). k Percentages of total quantified HS disaccharides in HaCaT WT (Supplementary Table 3). Source data are provided as a Source Data file for all graphs.

