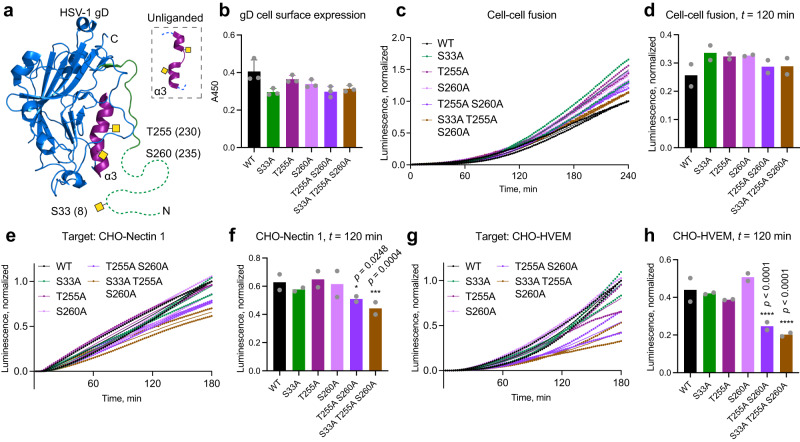
Fig. 7. Single O-glycosites contribute to gD-initiated cell-cell fusion via distinct receptors.
a HSV-1 gD structure (PDB: 2C36) with select mutated O-glycan acceptor sites indicated. Positions after removal of signal peptide, often encountered in the literature, are indicated in brackets. Respective previously identified O-glycans were drawn manually as yellow squares. N-terminal region omitted in the crystal structure is drawn as a dashed line. b Cell surface expression of gD O-glycosite mutants evaluated by CELISA. Data is shown as mean absorbance at 450 nm +SD of three technical replicates and is representative of three independent experiments. One-way ANOVA followed by Dunnett’s multiple comparison test was used to evaluate differences from WT. c Cell-cell fusion activity over 240 min using gD O-glycosite mutants. Data from two independent experiments is shown, where mean normalized luminescence of three technical replicates at each time point is indicated by a dot. Mean values of the two independent experiments are shown as thin lines. Data is normalized to maximum luminescence reading at final time point using WT gD for each experiment. d Cell-cell fusion activity of gD mutants at t = 120 min. Data is shown as mean normalized luminescence from two independent experiments. Two-way ANOVA followed by Dunnett’s multiple comparison test was used to evaluate differences from WT. CHO cells stably expressing Nectin 1 (e, f) or HVEM (g, h) were used as target cells to evaluate cell-cell fusion activity using gD O-glycosite mutants. Cell-cell fusion activity over 180 min using CHO-Nectin 1 (e) or CHO-HVEM (g) as target. Parental CHO cell line without entry receptors was use for background subtraction. Data is presented as in (c). Cell-cell fusion activity of gD mutants at t = 120 min using CHO-Nectin 1 (f) or CHO-HVEM (h) as target. Data is shown as mean normalized luminescence from two independent experiments. Two-way ANOVA followed by Dunnett’s multiple comparison test was used to evaluate differences from WT (*p < 0.05, **p < 0.01, ***p < 0.001, ****p < 0.0001). Source data are provided as a Source Data file for all graphs.

