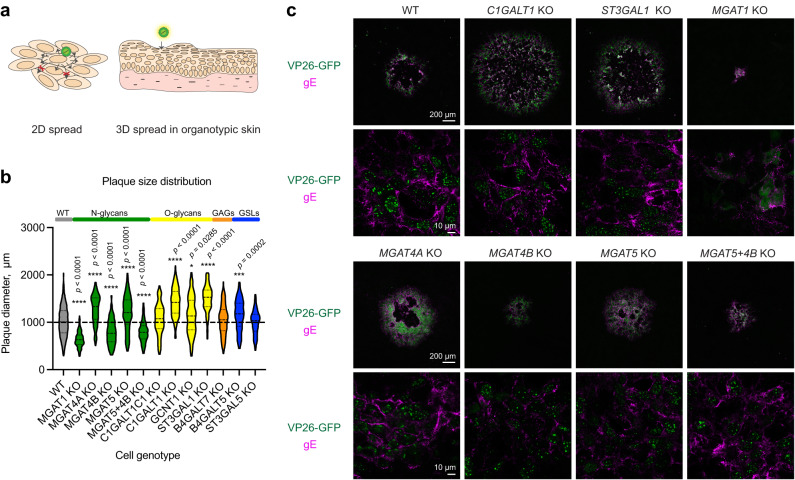
Fig. 8. HSV-1 cell-to-cell spread in mutant cell monolayers.
a The cartoon illustrates different modes of HSV-1 cell-to-cell spread in 2D glycoengineered HaCaT cell monolayers in the context of a plaque assay, and spread in 3D organotypic skin models. b Plaque diameter on cell monolayers infected with HSV-1 Syn17+ at 48 hpi. Data is presented as violin diagrams that include measurements from 3 independent experiments for each KO cell line, with 50 plaques measured for each experiment. Paired WT data includes measurements from 15 independent experiments. The dashed lines within the plots indicate median diameter, whereas the dotted lines indicate the interquartile range. One-way ANOVA followed by Games-Howell’s multiple comparison test was used to evaluate differences from WT (*p < 0.05, **p < 0.01, ***p < 0.001, ****p < 0.0001). Source data are provided as a Source Data file. c Cell monolayers grown on cover slips were infected with 200 PFU (MOI < 0.0005) of HSV-1 K26-GFP and overlaid with semi-solid media for 48 h followed by fixation and staining for HSV-1 gE (magenta). GFP labeled capsid proteins (VP26) are seen in green. Confocal images at two different magnifications were taken to illustrate overviews of plaques (4 combined tiles at 10x, upper panels) as well as gE expression at higher resolution (63x, lower panels). Scale bars for the different magnifications are indicated.

