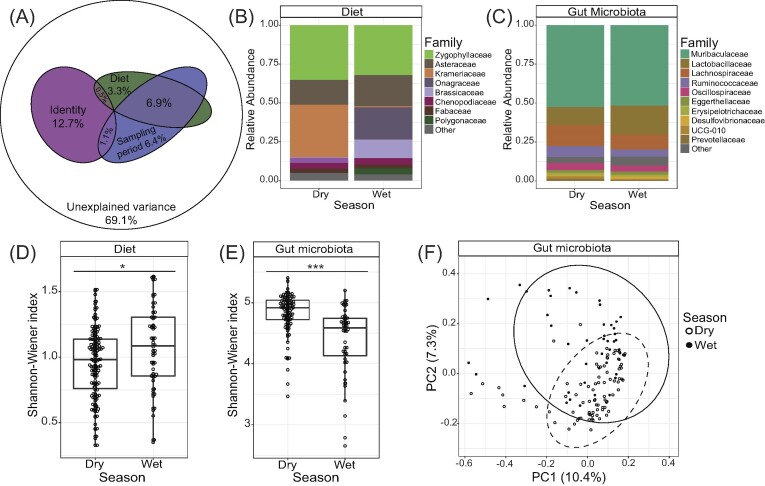
Figure 1.
Factors influencing the composition of gut microbiota and diet of woodrats at Whitewater. (A) Euler diagram displaying the significant explanatory factors and their % variance on gut microbiome composition based on redundancy analysis for the entire dataset. (B) Relative abundance of diet items at the family-level averaged by season. (C) Relative abundance of gut bacteria binned by Order by season. (D) Diet diversity by season. Diet was more diverse in the wet season (Kruskal–Wallis test: χ2 = 5.112, P = .024). (E) Gut microbiome diversity by season. Gut microbial communities were more diverse in the dry season (Kruskal–Wallis test: χ2 = 26.564, P < .001). (F) Principal coordinates analysis of the gut microbiome based on Bray–Curtis distances. Season was a significant factor in structuring microbial communities (PERMANOVA: Sum of squares = 1.065, Pseudo-F = 5.054, R2 = 0.030, P = .001). Ellipses represent 95% confidence intervals. Significant differences are denoted by * (* = P < .05; ** P < .01, and *** P < .001).

