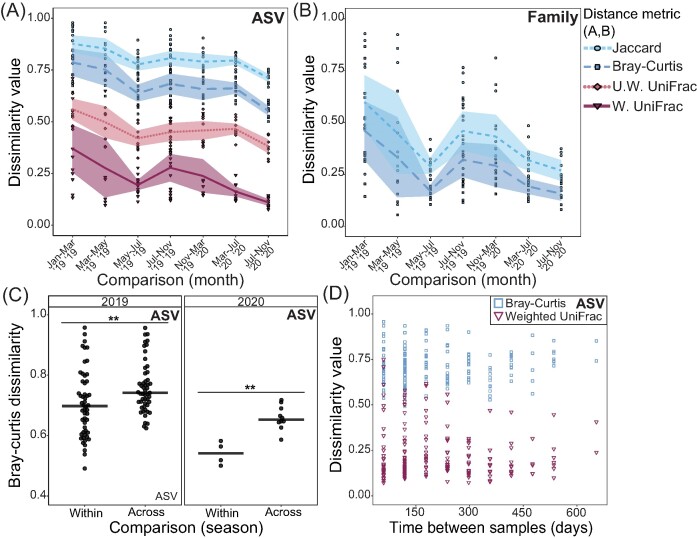
Figure 2.
Gut microbiota compositional dissimilarity by time and season at the individual-level. (A) Individual pairwise gut microbiome dissimilarity at the (A) ASV-level and (B) Family-level for each trip comparison and distance metric in chronological order. Lines and filled areas present moving averages and 95% confidence intervals, respectively, and are colored by distance metric. (C) Bray–Curtis dissimilarity from within the same season (i.e. dry to dry, wet to wet) or across seasons (i.e. dry to wet, wet to dry) for each sampling year. Individuals’ gut microbiomes were more dissimilar when sampled across seasons in 2019 (Kruskal–Wallis test: χ2 = 8.08, P = .004) and 2020 (Kruskal–Wallis test: χ2 = 8.00, P = .005). (D) Gut microbiome dissimilarity as a factor of time between sample comparisons. There was no significant relationship between dissimilarity and time between samples for either Bray–Curtis (GLM; P > .05) or weighted UniFrac distances (GLM; P > .05). Significant differences are denoted by * (* = P < .05; ** P < .01, *** P < .001).

