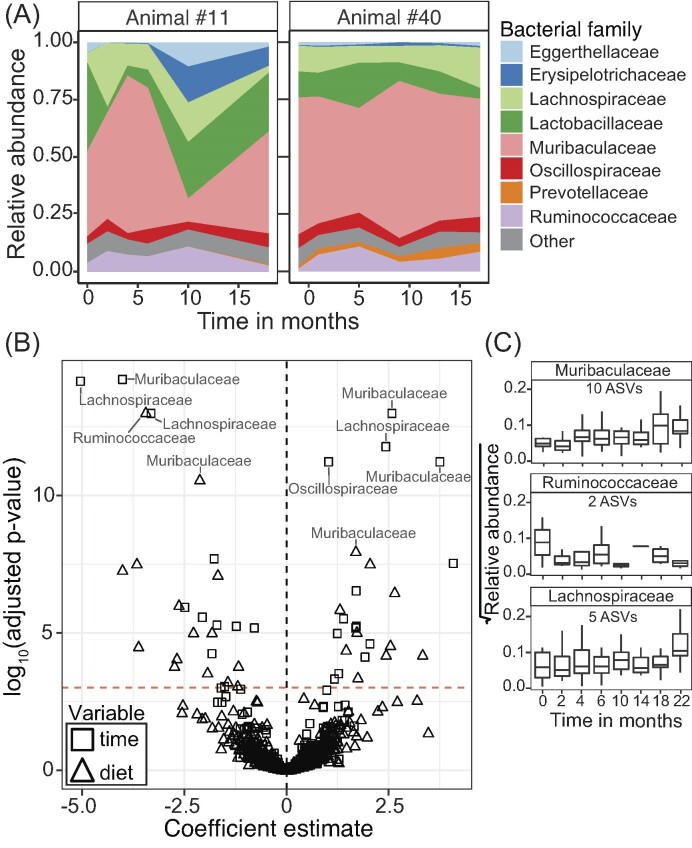
Figure 3.
Temporal trends of gut microbial composition in woodrats at Whitewater. (A) Relative abundance of the top eight most abundant bacterial families over time in two individual woodrats. Examples of large shifts (Animal #11) and small shifts (Animal #40) in bacterial family composition over time. (B) Results from a zero-inflated negative binomial mixed model on bacterial ASVs and the factors of time and diet on influencing their abundance. Dashed red line indicates the significance threshold. In total, the abundance of 50 ASVs were significantly correlated with time or diet. (C) Boxplots demonstrating the relative abundance of ASVs that were found to have significant differential abundance over time across all individuals. ASVs were binned at the rank of family.

