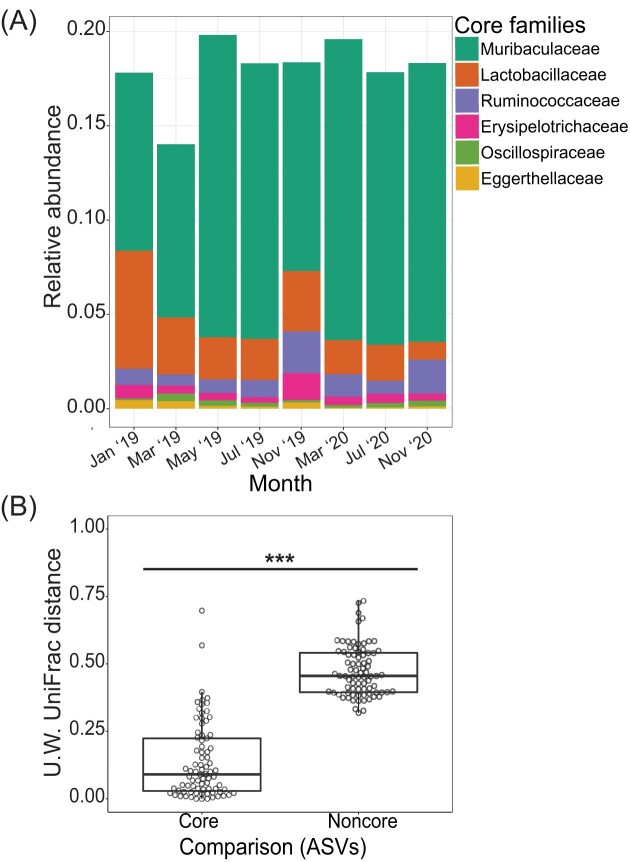
Figure 4.
Core gut bacterial members and their temporal dynamics. (A) Relative abundance of the 26 core ASVs binned at the family-level by sampling date. (B) Core ASVs were significantly more stable than noncore ASVs across all pairwise comparisons of samples from the same individual (Kruskal–Wallis test: χ2 = 105.37, P < .001). Significant differences are denoted by * (* = P < .05; ** P < .01, and *** P < .001).

