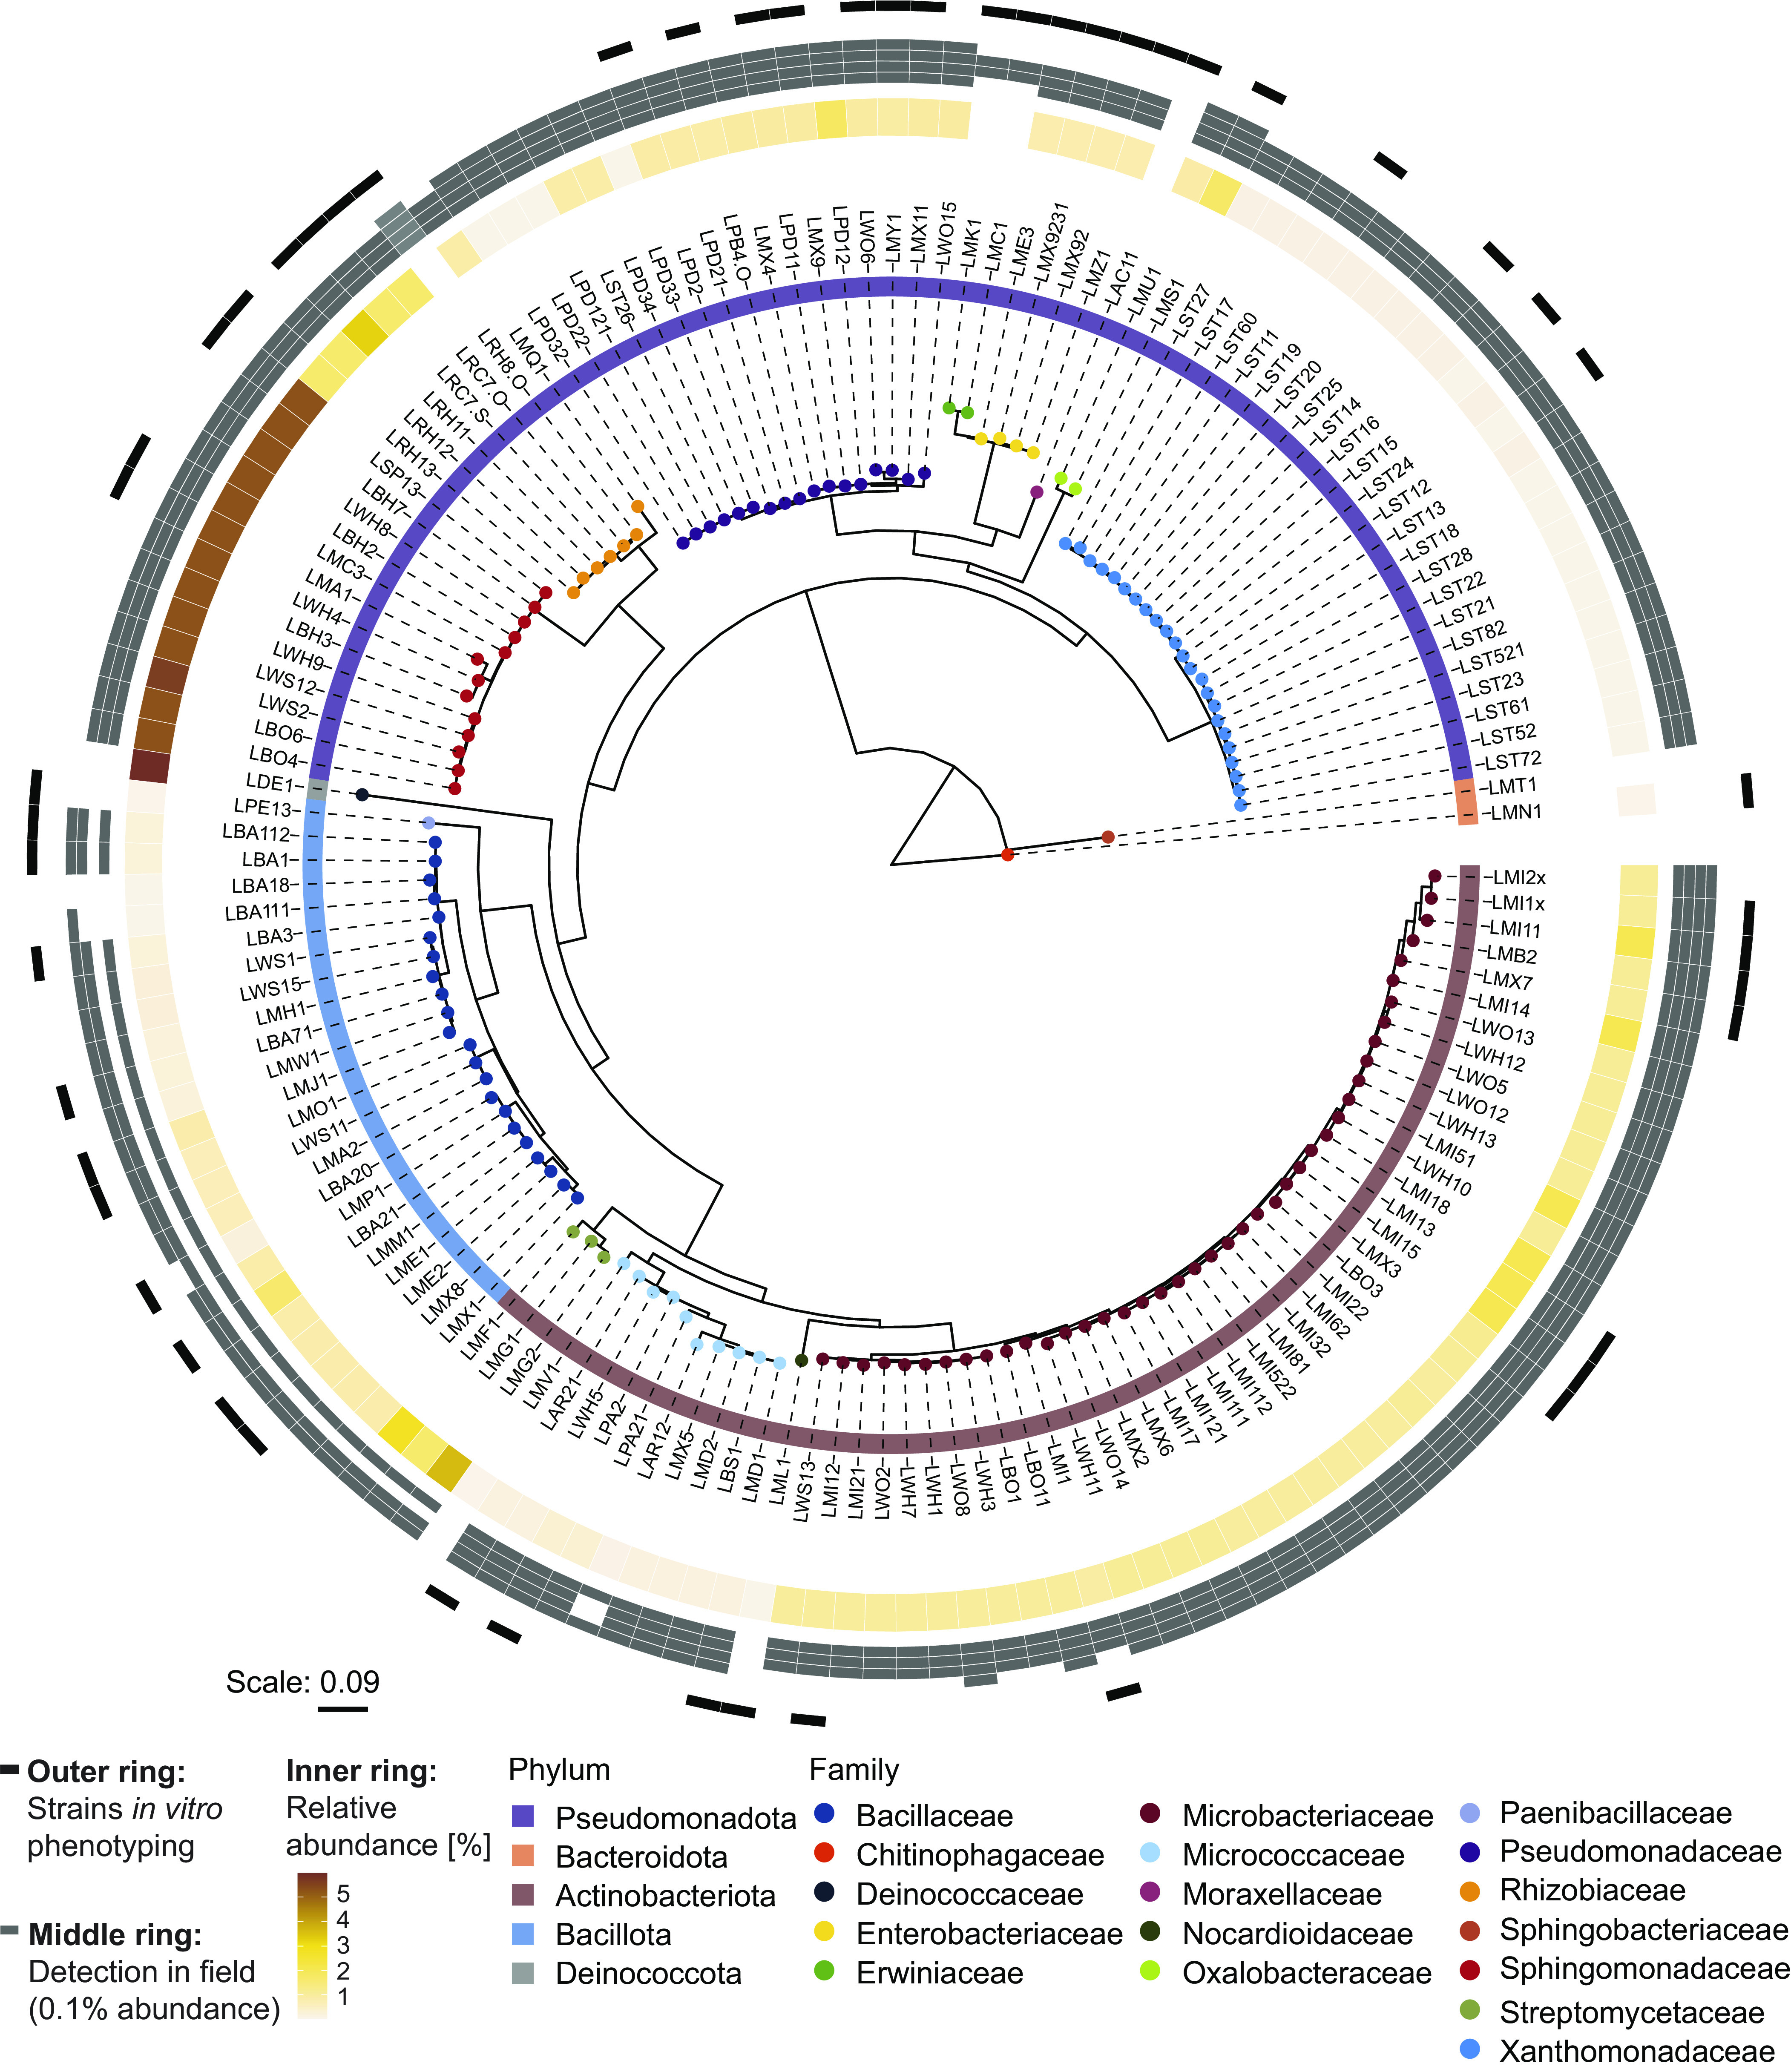
Fig. 1.

MRB collection. Maximum likelihood phylogeny, constructed from the alignment of 16S rRNA gene sequences. Leaf nodes are colored by family taxonomy, and the ring next to the strain IDs reports phylum taxonomy. The rings on the outside of the tree show the abundance of the strains in different microbiome datasets: The inner ring is colored according to the relative abundance (%) of the corresponding sequence in the microbiome profile of the roots, from which the isolates were isolated from (origin of isolation). Gray boxes in the middle ring mark when a strain was detected (>0.1% abundance) in root microbiome datasets of maize grown in greenhouse and field experiments (Changins field data from ref. (37); Reckenholz and Aurora data from ref. (35)) or a greenhouse experiment with field soil (Sheffield data from ref. (36)). The order of datasets (references) in the ring with gray boxes: inside to outside. The outer ring denotes in black the representative strains used for tolerance assays.
