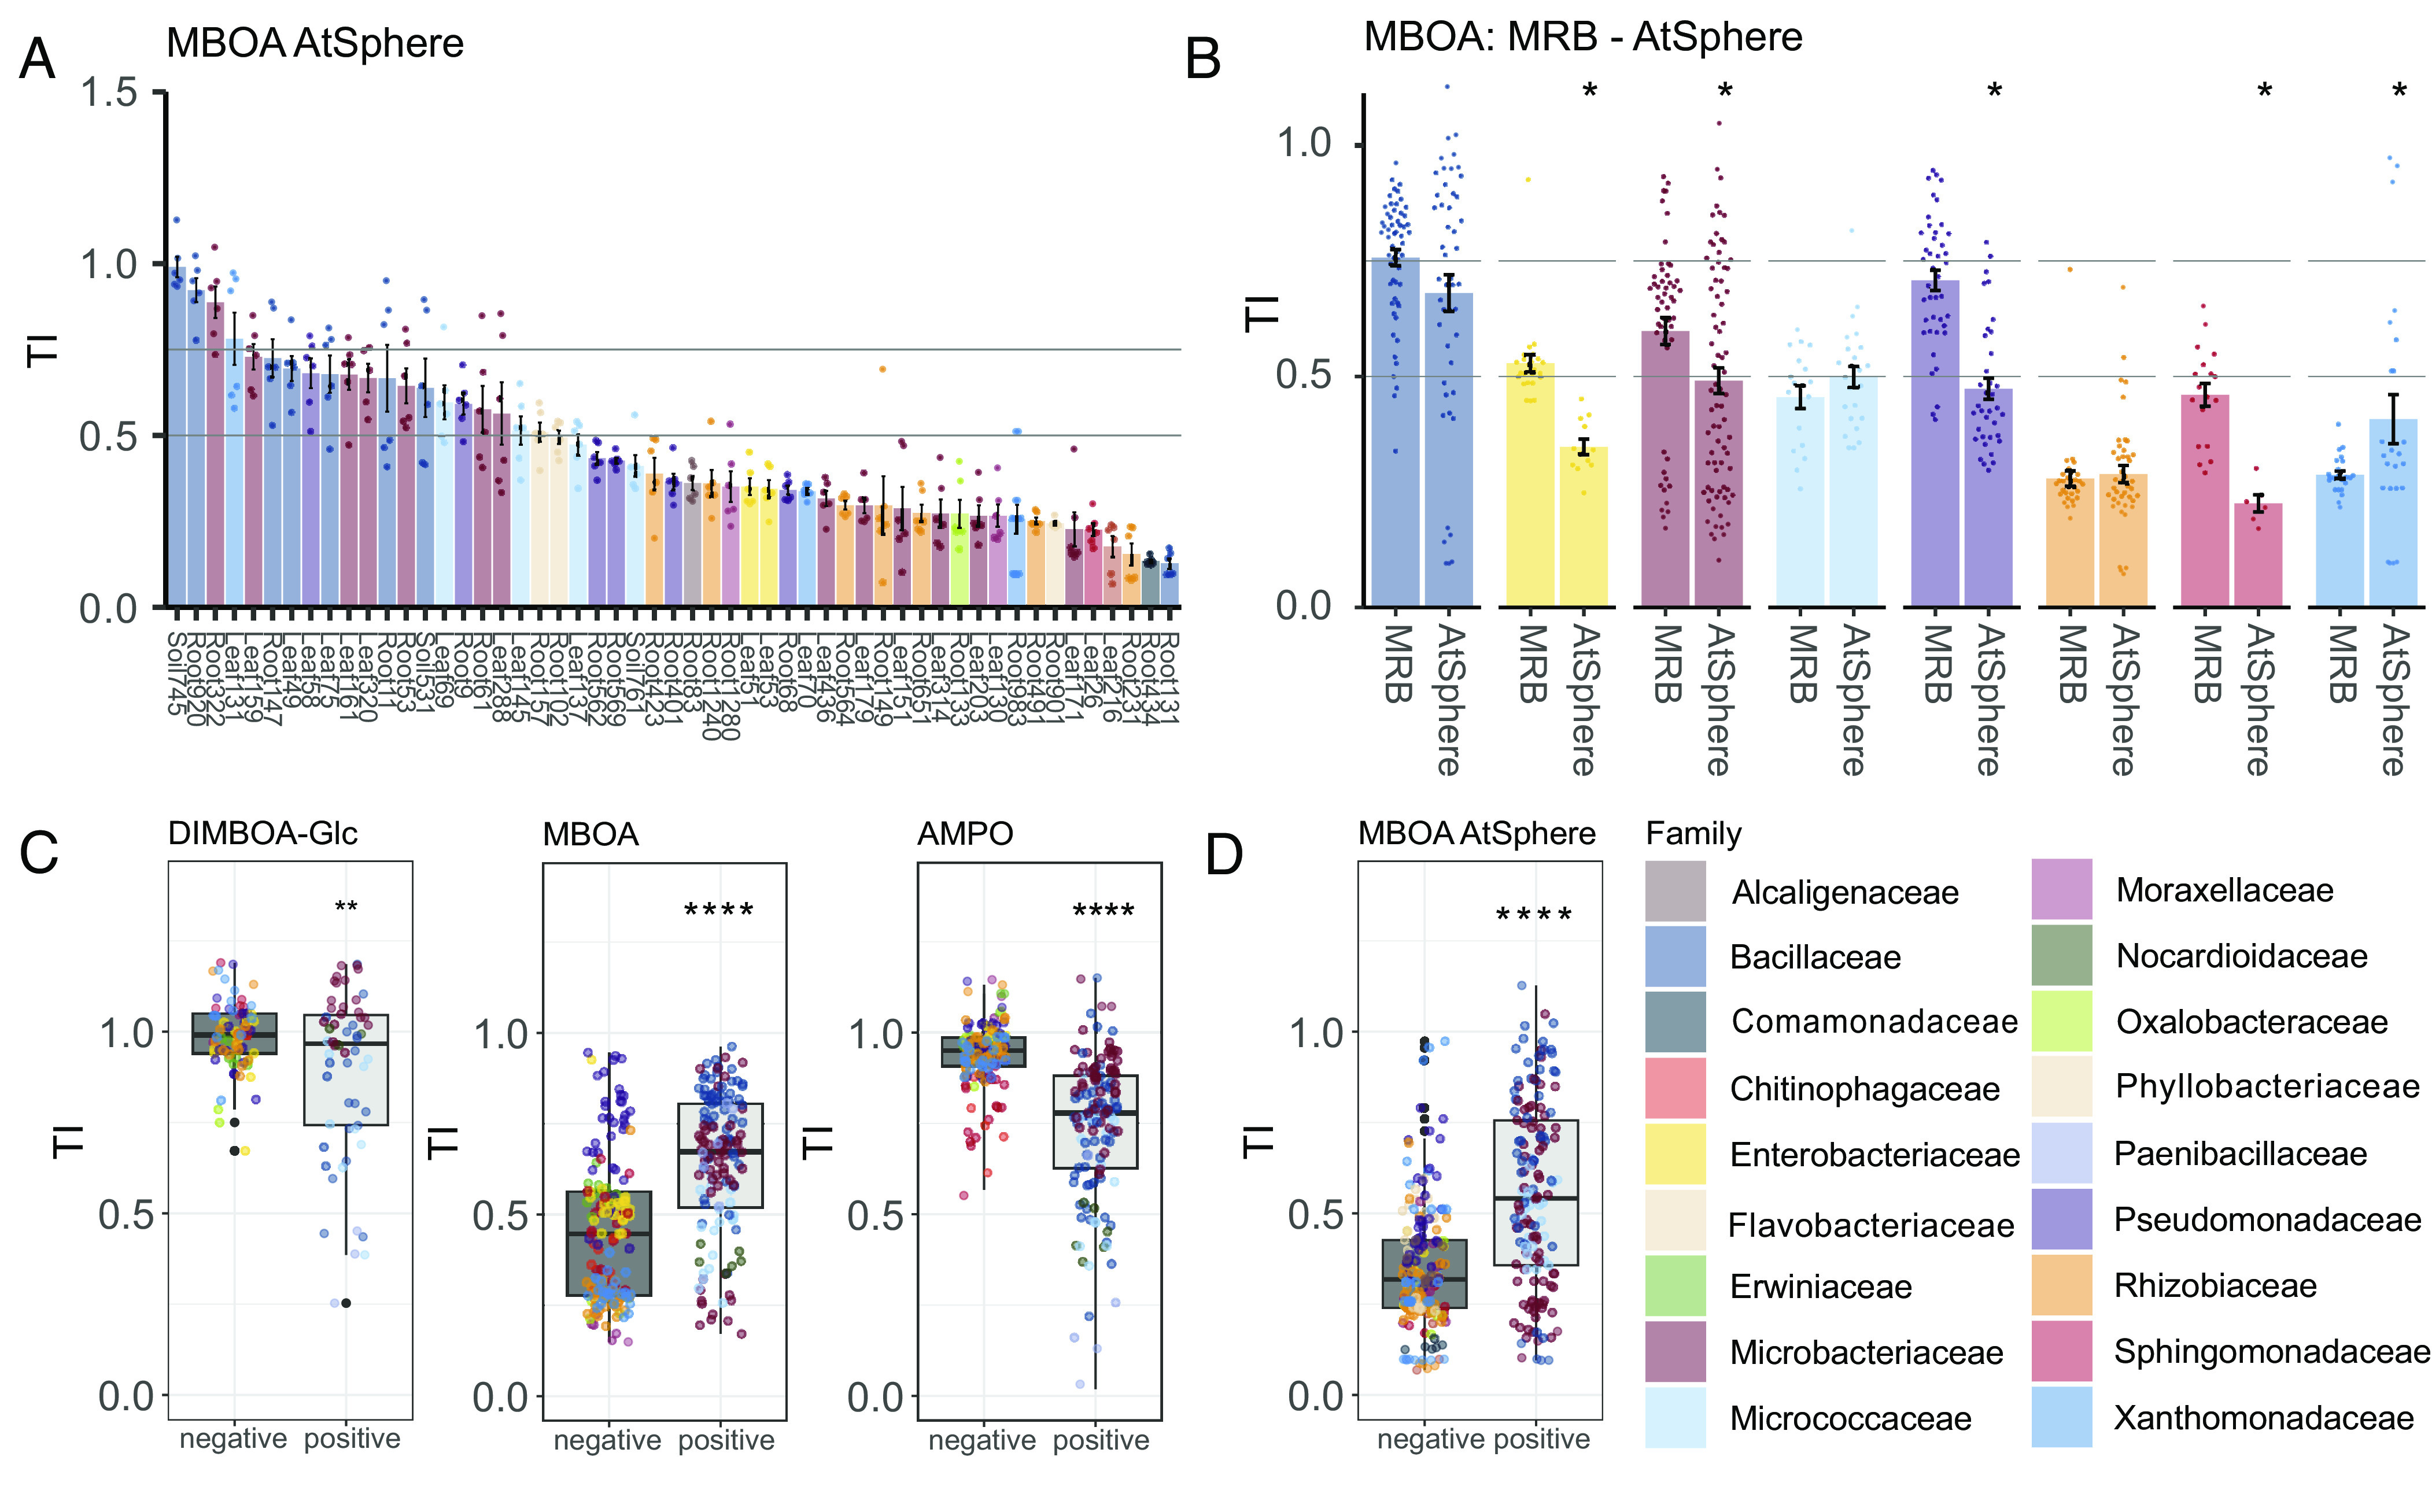
Fig. 3.

Host-specific tolerance of plant bacteria and cell wall structure defining tolerance. (A) TIs of Arabidopsis bacteria of the AtSphere collection to MBOA. Bargraph reports the mean TIs ±SE of 6 replicates. See SI Appendix, Fig. S12 for the underlying growth data and the pairwise statistical analyses. (B) Comparison of TIs to MBOA of MRB and AtSphere strains, summarized by taxonomic families. Strains are represented based on 6 replicate measurements, statistically compared using t tests (asterisks denote significance: P < 0.05*). (C) TIs to DIMBOA-Glc, MBOA, and AMPO summarized for gram-negative and gram-positive MRB strains and (D) AtSphere strains. Graphs report replicate measurements per strain (n = 3 for DIMBOA-Glc, n = 6 for MBOA and AMPO) and statistical analysis (t test, asterisks denote significance: P < 0.01**, P < 0.0001****). Colors by family taxonomy.
