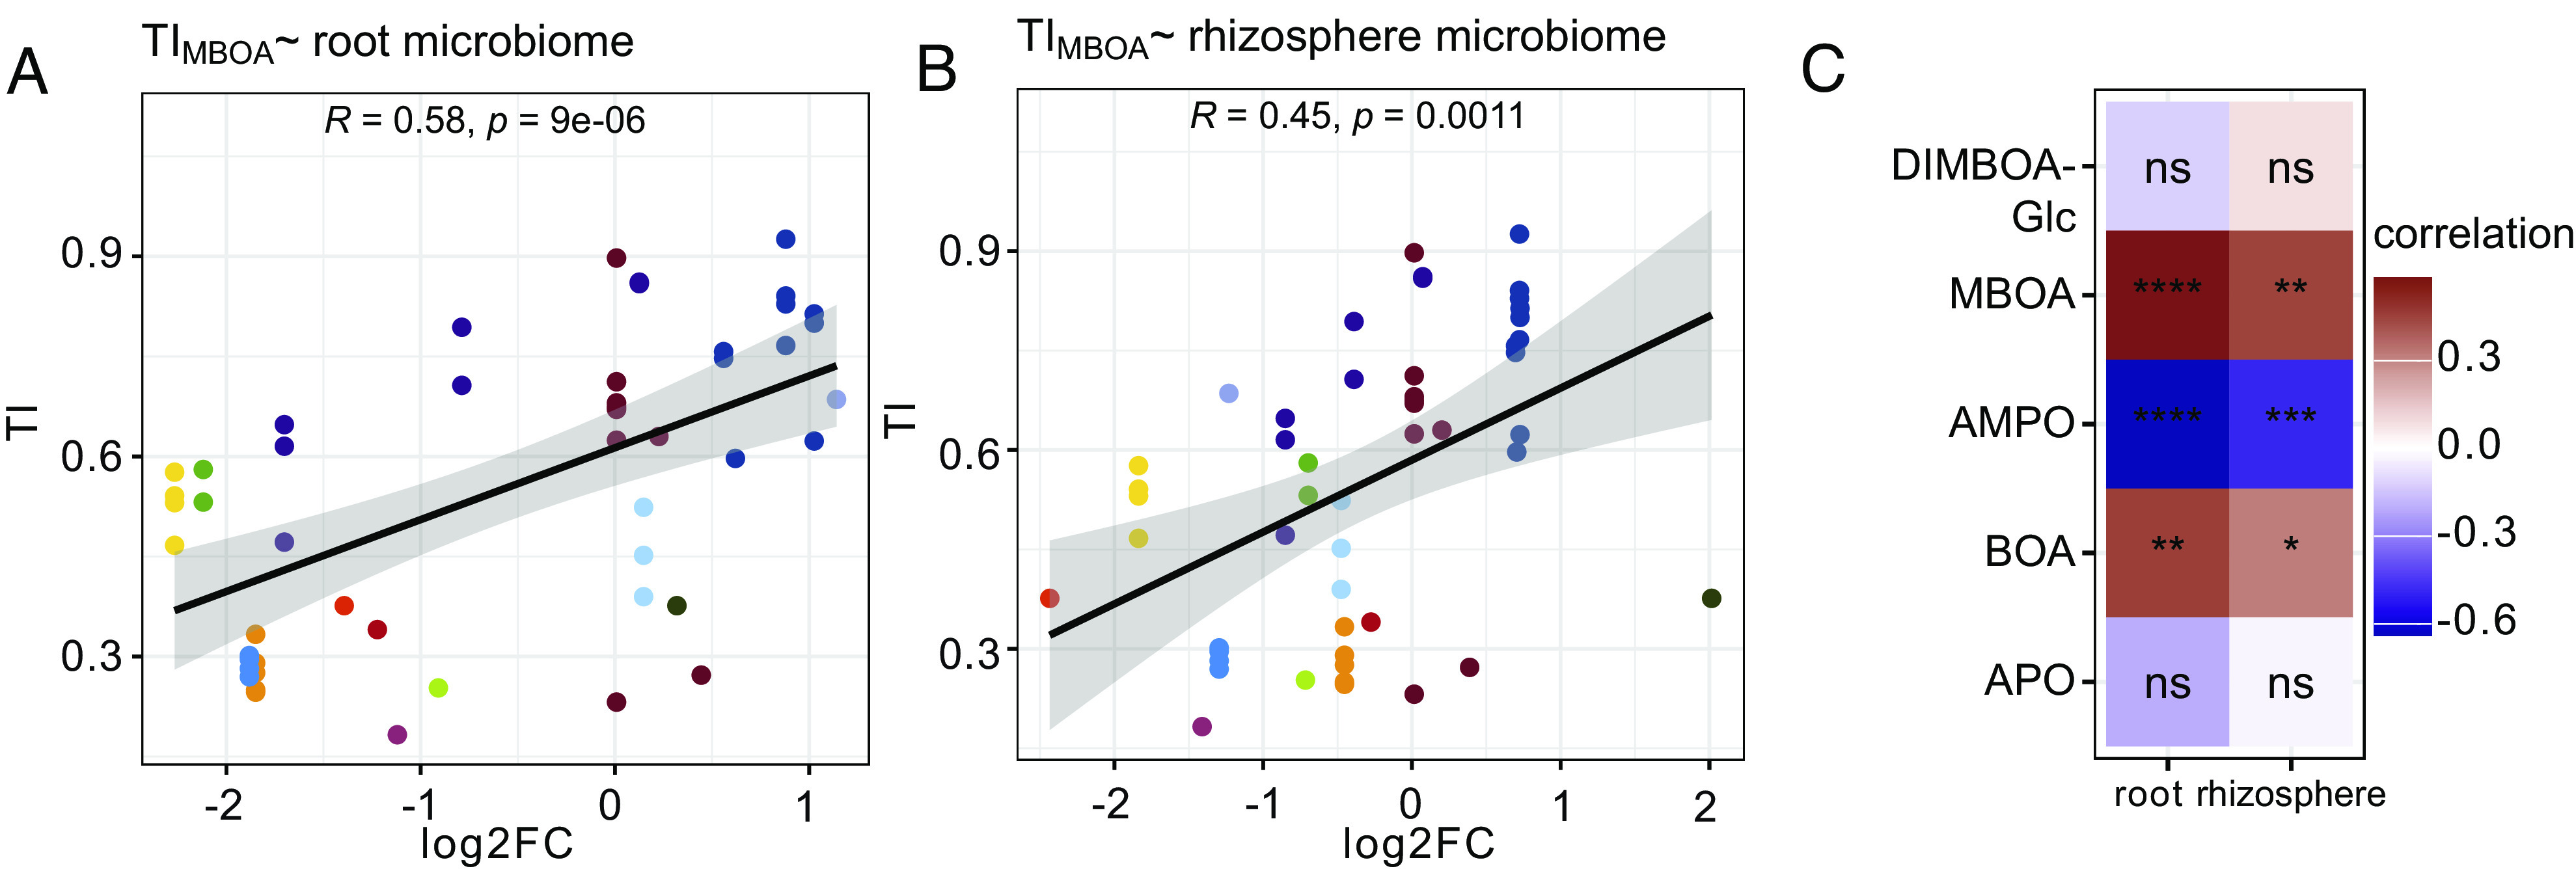
Fig. 4.

Correlations between in vitro tolerance and BX-dependent abundance in root and rhizosphere microbiomes. Correlations between TIs of all MRB strains to MBOA with the log2 fold changes (log2FC; comparing wild-type vs. bx1 plants) of their corresponding OTUs in (A) root and (B) in rhizosphere microbiome profiles. The correlation coefficient R and the P-value of the Pearson’s product-moment correlation test are reported inside the panels. Each data point reports the mean TI of a strain (means based on n = 6 replicates), colors by family taxonomy. The heatmap in (C) summarizes this analysis for all tested compounds (see SI Appendix, Fig. S14 for additional correlation analyses with DIMBOA-Glc, AMPO, BOA, and APO). Colors refer to the correlation coefficient R, and the statistical significance is indicated by asterisks (levels: ns = not significant, P < 0.05*, P < 0.01**, P < 0.001***, and P < 0.001****).
