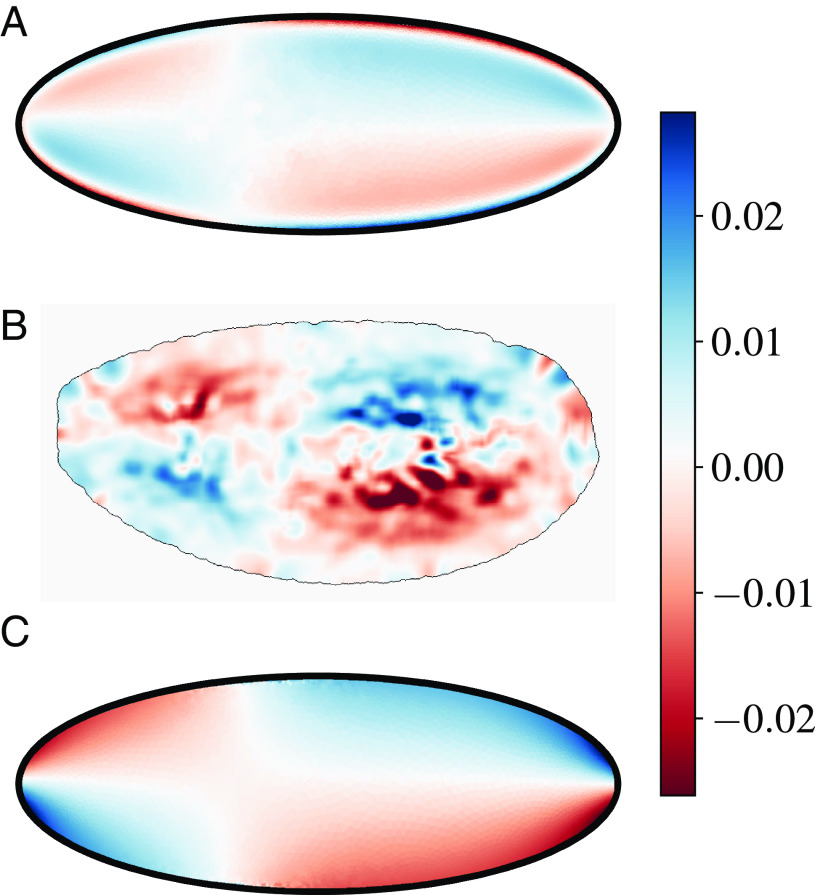
Fig. 3.
Our model explains experimental observations of the sol vorticity. (A) and (B) A heatmap showing the vorticity field () of the sol flow in our model (A) and in experiments (B). (C) The total vorticity (normalized by to preserve its physical dimensions), showing its extrema at the boundary of the domain, which reflect the harmonic nature of the field in our specific model (see Discussion in the body of the paper).

