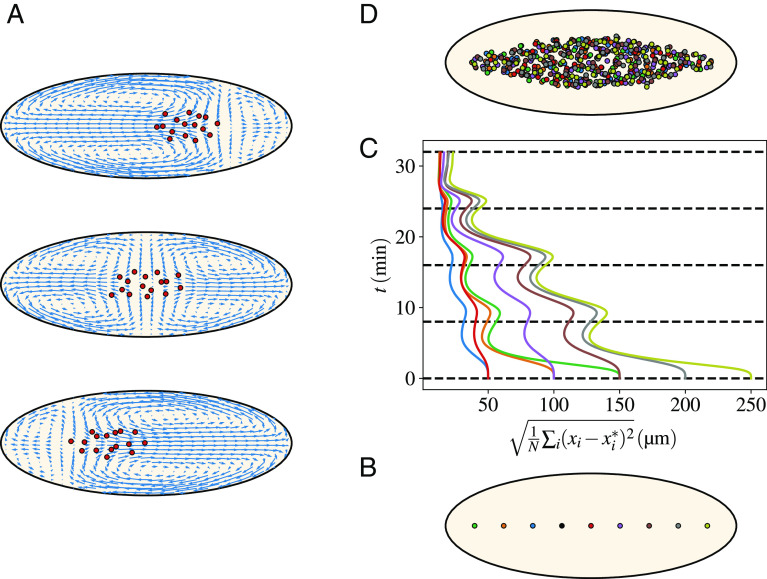
Fig. 7.
Flows ensure a uniform distribution of nuclei along the AP embryonic axis irrespective of the initial nucleus’ location. (A) Three different flow geometries controlled by the location of the nuclear cloud, illustrating the self-centering effect. (B) A series of positions (coded by different colors) for the first nucleus that starts the division cycles. The nine different locations go from to of the embryo AP length. The reference configuration has the nucleus placed at of the embryo AP length. (C) The evolution in time (flowing upward) of the distance with respect to the reference configuration. The distance is defined as , where is the total number of nuclei (at that time), and are the positions of nuclei in the reference or the displaced configurations. The best matching that minimizes the total distance between the two sets of nuclei is obtained by using the Belief Propagation algorithm described in the Materials and Methods. Colors of the curves correspond to the initial positions in the bottom panel. Three pairs correspond to the two sides of the reference positions and the last two curves refer to the initial positions at and of the AP length. (D) The final configurations of nuclei (for the whole ensemble of colors). Note that all colors are mixed up, witnessing the self-correcting nature of the AP spreading process. That is shown more quantitatively by the middle curves, which all reduce to values corresponding to distances of a few microns distance between pairs of nuclei of the various configurations.

