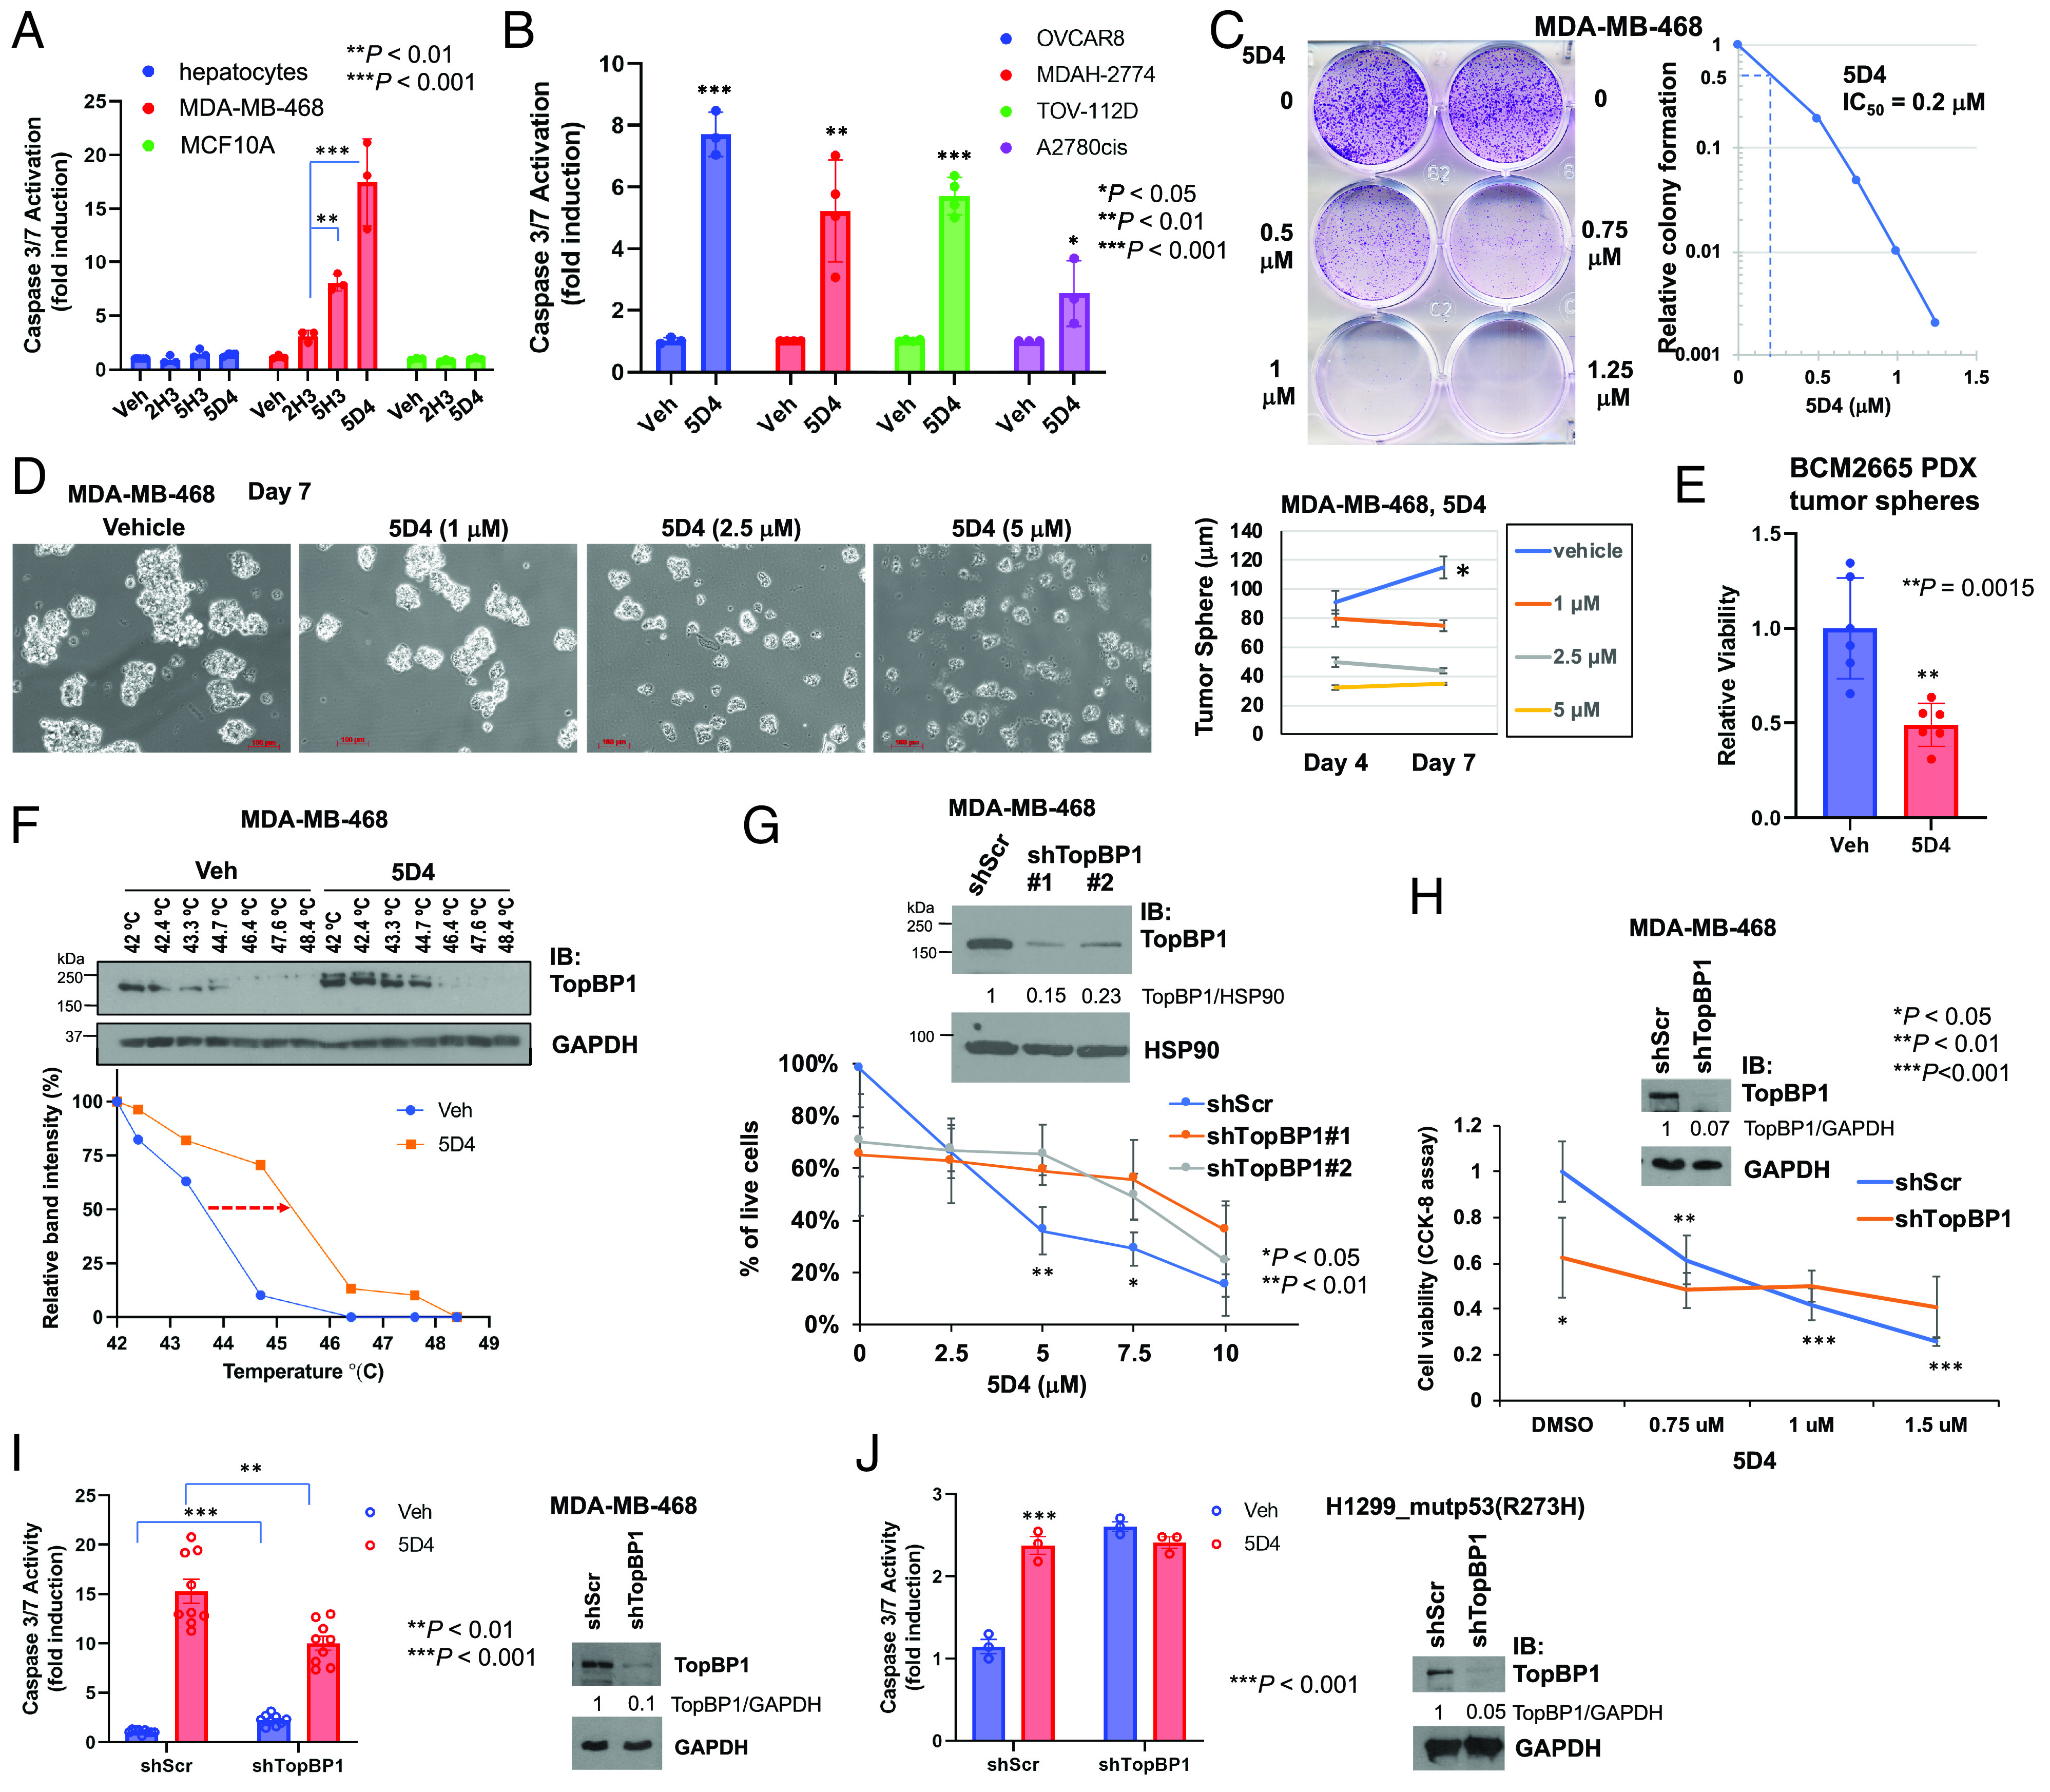
Fig. 3.

Cpd 5D4 induces apoptosis and inhibits cell viability in 2D and 3D cultured breast and ovarian cancer cells. (A and B) Cpd 5D4 induces apoptosis in breast and ovarian cancer cells but only has minimal effect on nontransformed AML12 mouse hepatocytes and MCF10A. Different cell lines as indicated were treated with DMSO or 5 µM 2H3, 5H3, or 5D4 for 18 to 22 h. Apoptosis was determined by Caspase-Glo® 3/7 Assay. Data shown are the mean ± SD of three or four independent experiments. *P < 0.05, **P < 0.01, and ***P < 0.001 vs. vehicle control (two-tailed t test). (C) Cpd 5D4 inhibits clonogenic survival of MDA-MB-468 cells. Cells were treated with DMSO or 5D4 for 24 h. After PBS washing, cells were cultured in fresh growth medium for another 4 d and then fixed and stained with 0.5% crystal violet. The right panel shows the relative colony formation compared to the vehicle control. The relative colony formation was analyzed using ImageJ to determine the IC50 of 5D4 (=0.2 µM). (D and E) Cpd 5D4 inhibits the growth of breast cancer tumor spheres. MDA-MB-468 cells were seeded on 6-well plates with cell-repellent surface. When the diameter of tumor spheres reached 30 to 50 µm, spheres were treated with DMSO or 5D4 on days 0, 3, and 6 (D). The images were captured 24 h after each treatment, and the diameter of tumor spheres was measured (scale bar, 100 μm). Data shown are the mean ± SEM of 40 to 60 spheres (*P < 0.05 vs. 5D4-treated cells). (E) BCM2665 PDX tissues were trypsinized and cells were cultured in Complete DMEM/F12 Media for Patient-Derived In Vitro and Organoid Cultures as described in NCI Patient-Derived Models Repository (SOP30101). After 10 d of culturing, tumor spheres were treated with DMSO or 5 µM 5D4 every other day for 6 d, followed by CCK-8 assay to determine the viability of tumor spheres. Data shown are the mean ± SD of two experiments done in triplicates. (F) Cellular thermal shift assay. MDA-MB-468 cells were treated with DMSO or 5D4 (10 µM) at 37 °C for 2 h. Cell lysates were heated for 3 min at temperature ranging from 42 to 48.4 °C, followed by immunoblotting. Quantification is shown in the Bottom panel. (G and H) TopBP1 depletion decreases cell viability and blunts the response to 5D4 in MDA-MB-468 cells. (G) The early-passage MDA-MB-468 cells stably harboring a scrambled shRNA (shScr) or one of the TopBP1 shRNAs (shTopBP1 #1 or #2) were treated with 5D4 for 19 h. The percentage of live cells was measured by trypan blue exclusion assay. Data shown are the mean ± SD of four biological replicates. *P < 0.05 and **P < 0.01 compared with shTopBP1 (two-tailed t test). (Upper) immunoblots confirming the depletion of TopBP1. The relative intensities of TopBP1 were quantified by ImageJ and normalized to loading control HSP90. (H) The early-passage MDA-MB-468 cells harboring shScr or shTopBP1 (#1) were treated with 5D4 for 24 h. Cell viability was determined by CCK-8 assay. Data shown are the mean ± SD of four biological replicates. **P < 0.01 and ***P < 0.001 vs. vehicle control (two-tailed t test). The intensities of TopBP1 on the immunoblot were quantified by ImageJ and normalized to GAPDH. (I) Depletion of TopBP1 increases the basal caspase-3/7 activity but attenuates 5D4-induced caspase-3/7 activation. MDA-MB-468 cells stably expressing shScr or shTopBP1 were treated with 3 µM 5D4 for 20 h, followed by caspase-3/7 activity assay. Data shown are the mean ± SD of nine biological replicates from four independent experiments. **P < 0.01 and ***P < 0.001 vs. treated and vehicle control cells, respectively (two-tailed t test). (J) Transient depletion of TopBP1 elevates the basal caspase-3/7 activity and blocks the further response to 5D4. H1299 cells stably expressing mutp53(R273H) were transiently transfected with a pSUPER vector harboring shScr or shTopBP1. After 48 h, cells were treated with 5 µM 5D4 for 21 h, followed by caspase-3/7 activity assay. Data shown are the mean ± SD of three biological replicates and are representative out of three independent experiments. ***P < 0.001 vs. vehicle control (two-tailed t test).
