
Fig. 1.
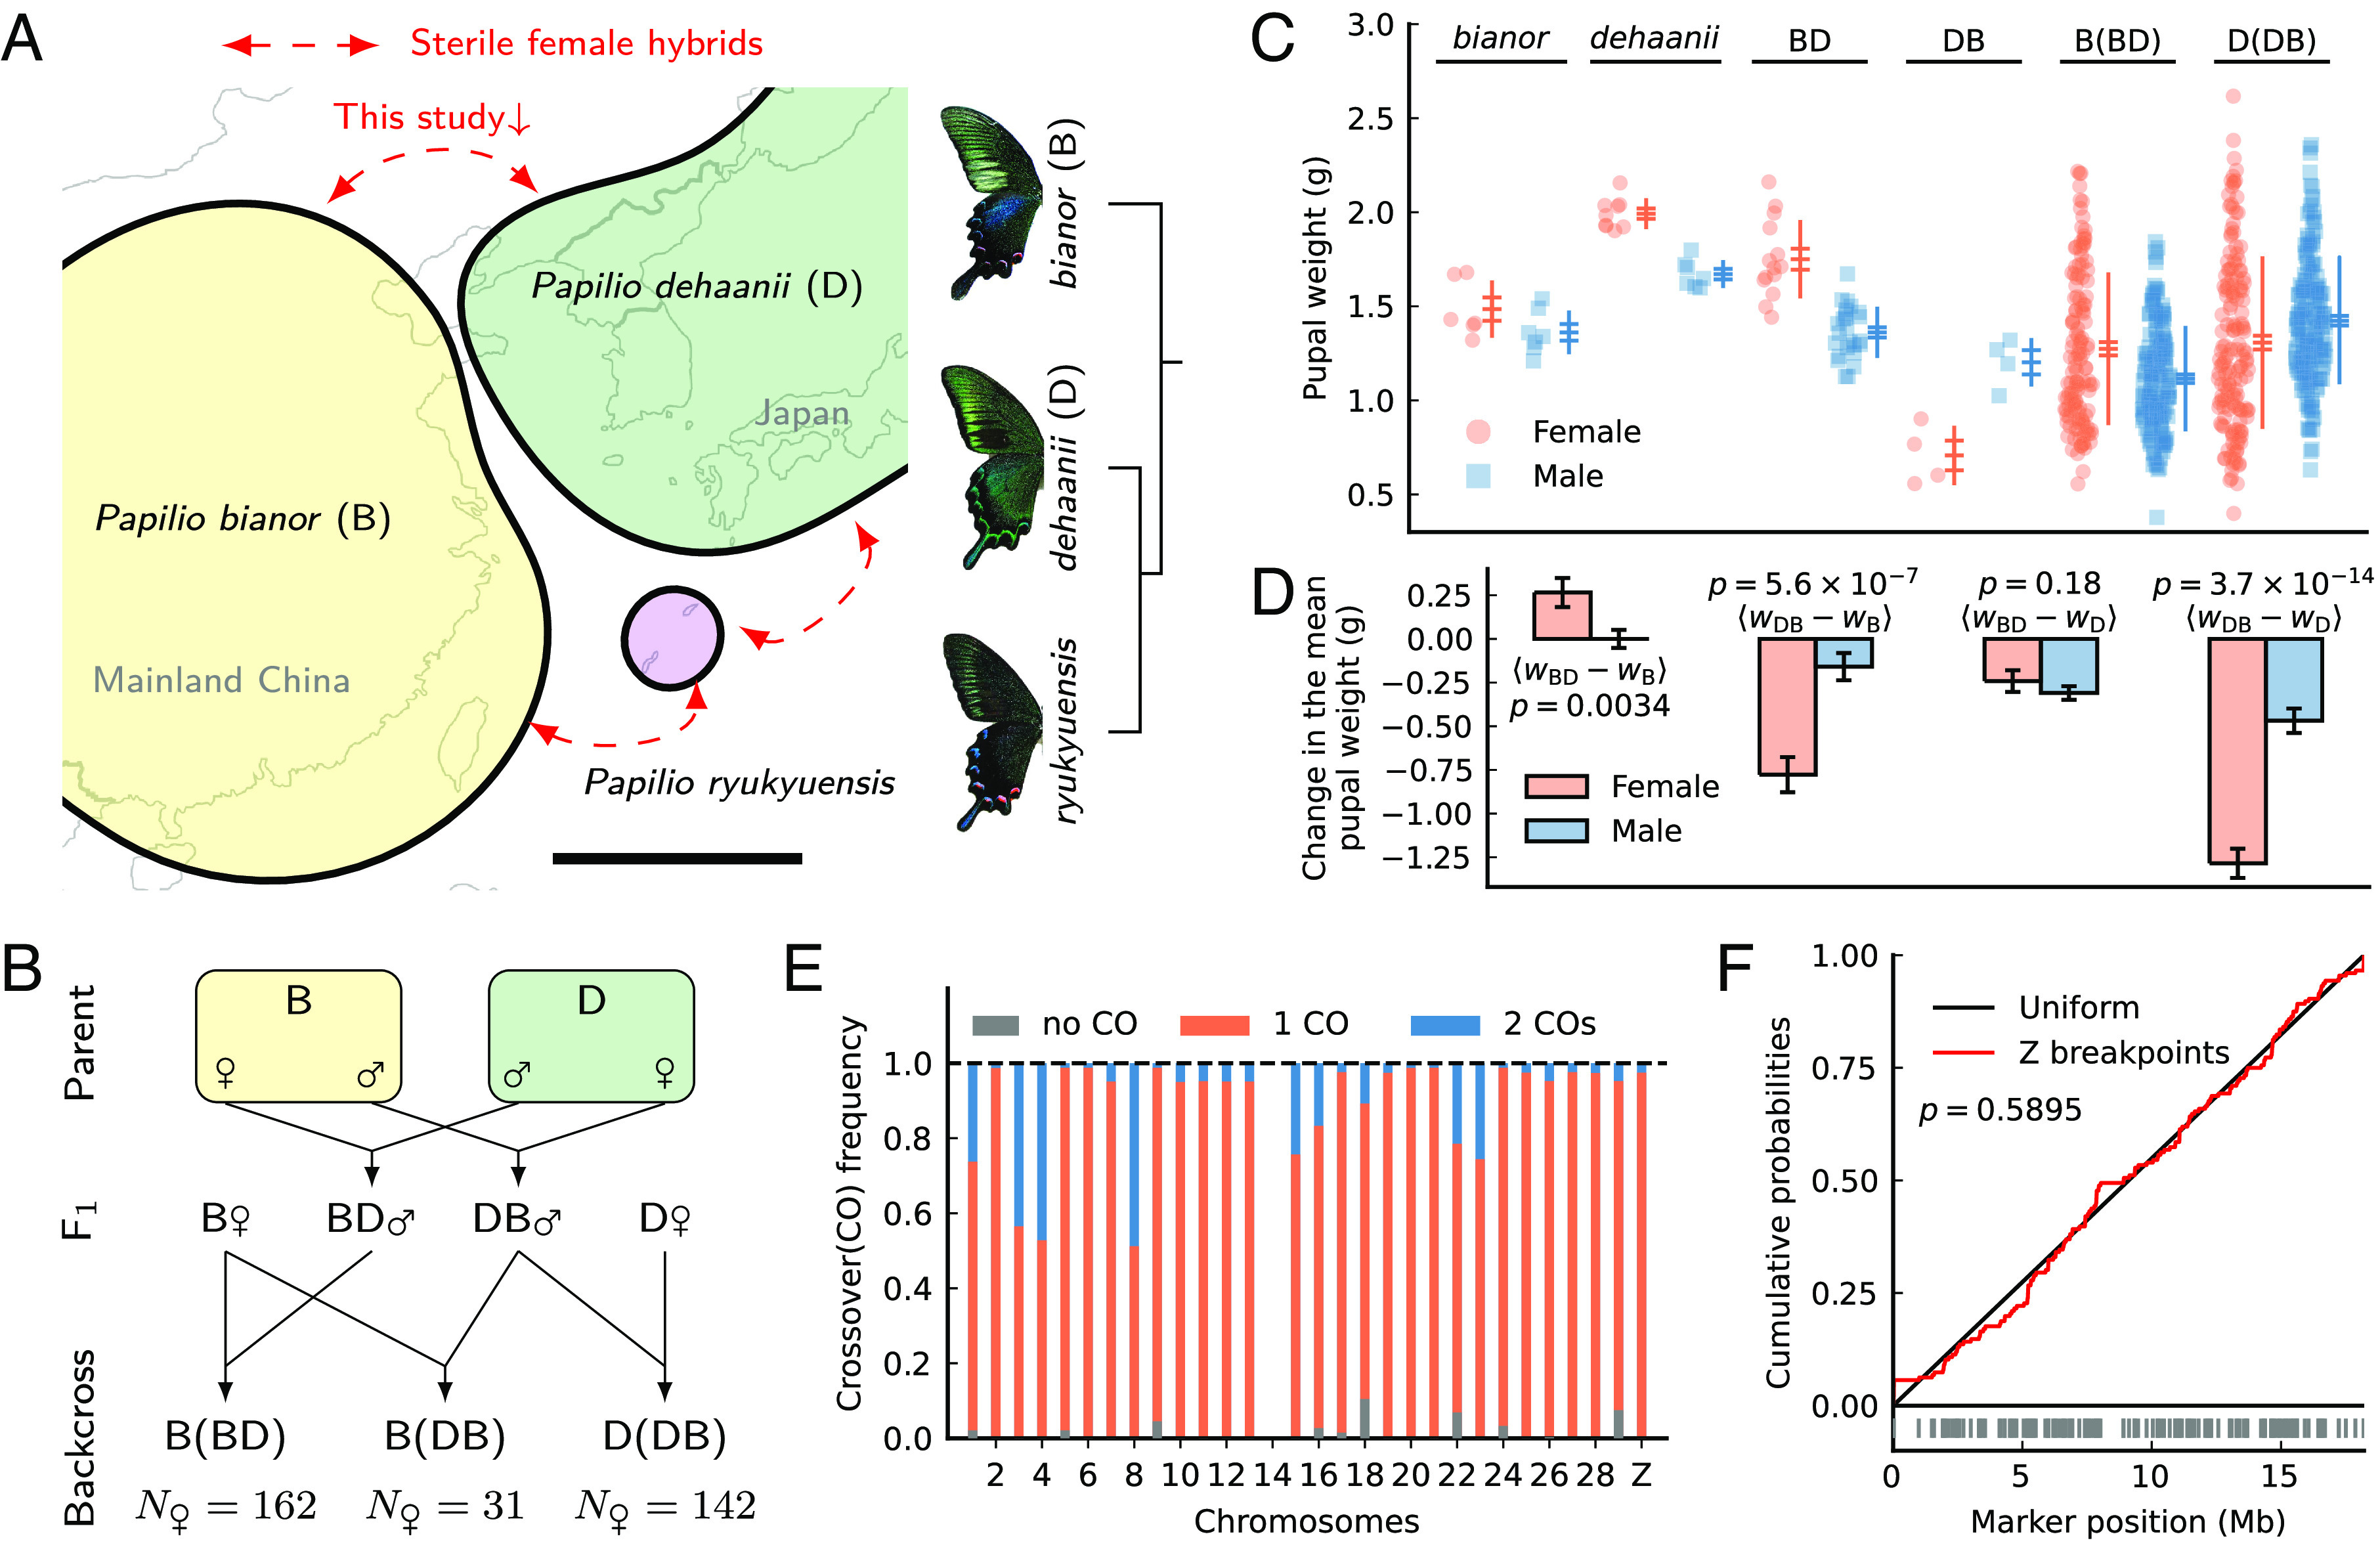
The study design, variation in pupal weight, and patterns of meiotic crossover in Papilio. (A) Geographic distribution and species relationships in the P. bianor complex (Scale bar; 1,000 km). (B) Crossing design. (C) Pupal weight variation among parents, F1s, and backcrosses. Horizontal bars represent the mean ± SE. Vertical lines represent the mean ± SD. (D) Changes in mean pupal weight between F1s and parents in each sex. Error bars are standard errors of the mean changes. The significance of male vs. female differences is shown as P-values of Z-tests. (E) The crossover frequency in F1 males per chromosome pair per meiosis. Chr14 is excluded due to assembly problems. (F) Recombination breakpoints on the Z chromosome are uniformly distributed (the P-value is from a Kolmogorov–Smirnov test). Vertical bars are inferred breakpoints.