
Fig. 3.
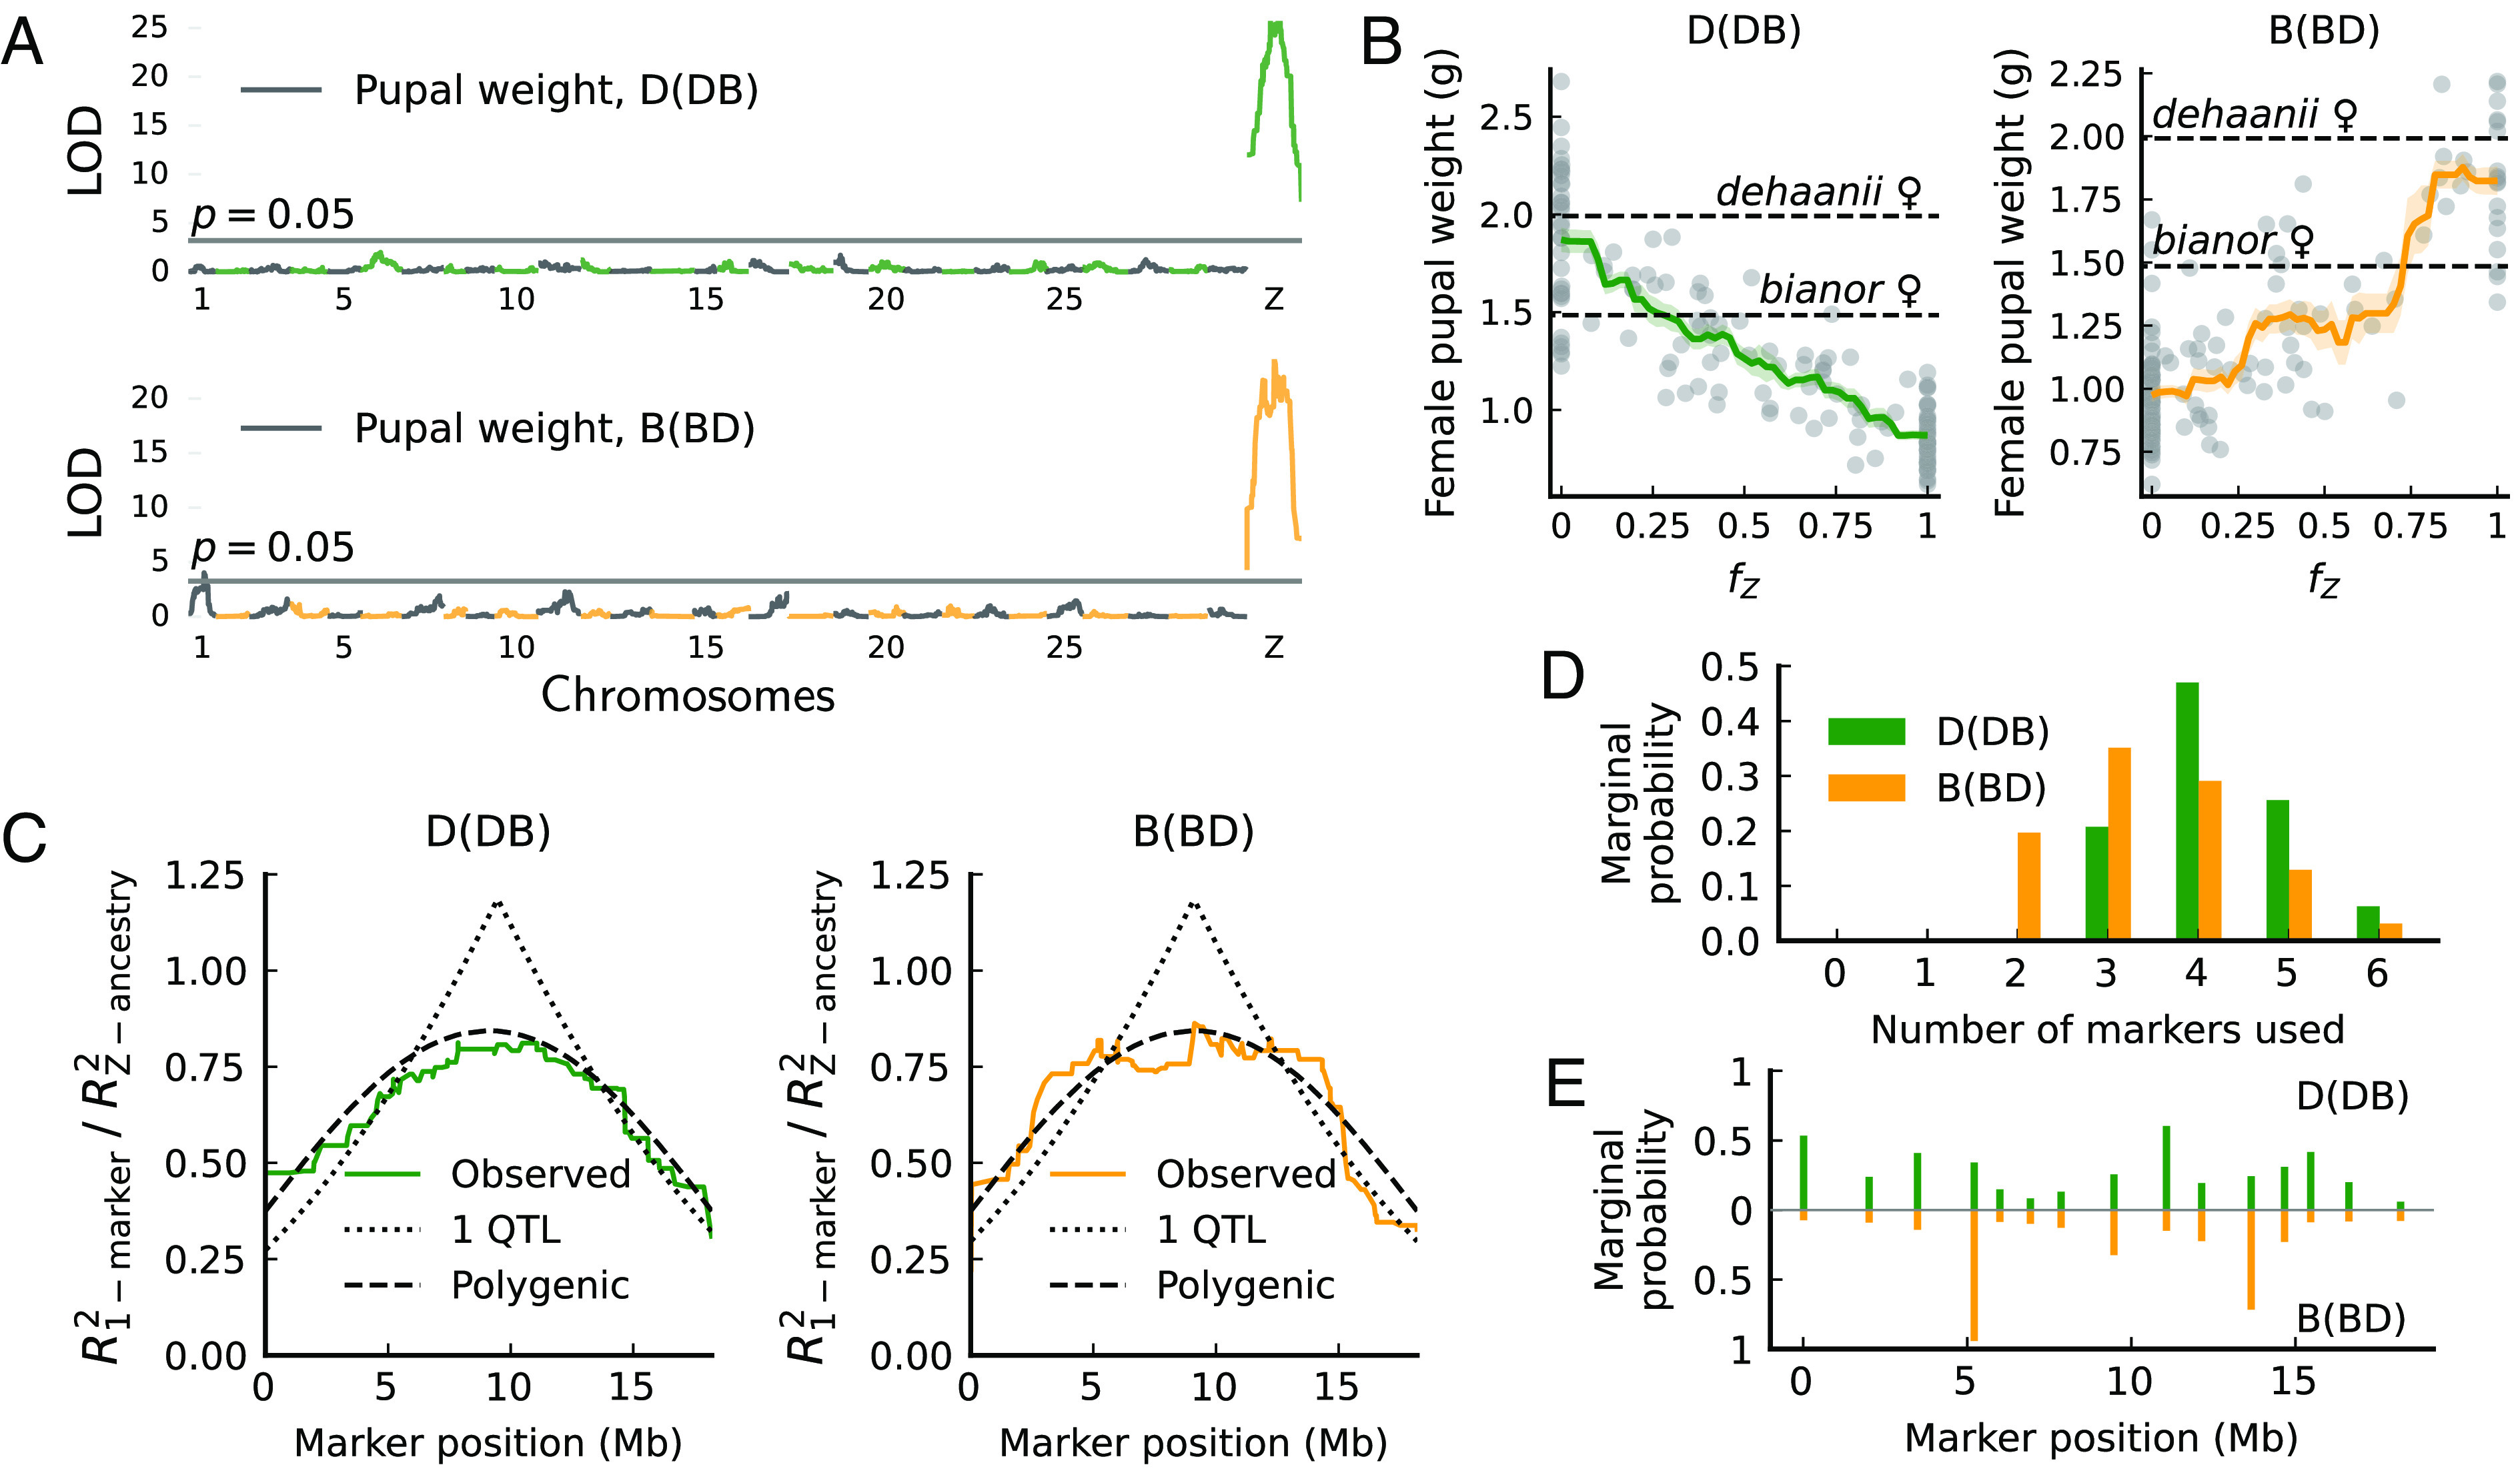
Pupal weight variation in female hybrids maps to many additive Z-linked effects in Papilio. (A) One-dimensional QTL scan shows that variation in pupal weight is mainly explained by the Z chromosome. LOD scores peak at the Z chromosome center. Alternating colors represent different chromosomes. (B) Introgressed ancestry fraction on the Z chromosome () is highly informative of pupal weight (adjusted by brood). (C) Genotype–phenotype regression does not support any 1-QTL architecture for pupal weight. The distribution of regression power is measured by (the ratio between using a single marker versus a polygenic model of Z chromosome ancestry). The polygenic model provides a better fit for the observed curves. (D and E) Bayesian QTL model selection (33) based on 15 sparsely spaced markers favors the simultaneous inclusion of multiple markers (3) in predicting pupal weight. Markers more favored by models have higher marginal probabilities of being selected. Marginal probabilities equal the partial sum of the posterior probabilities of QTL models.