
Fig. 4.
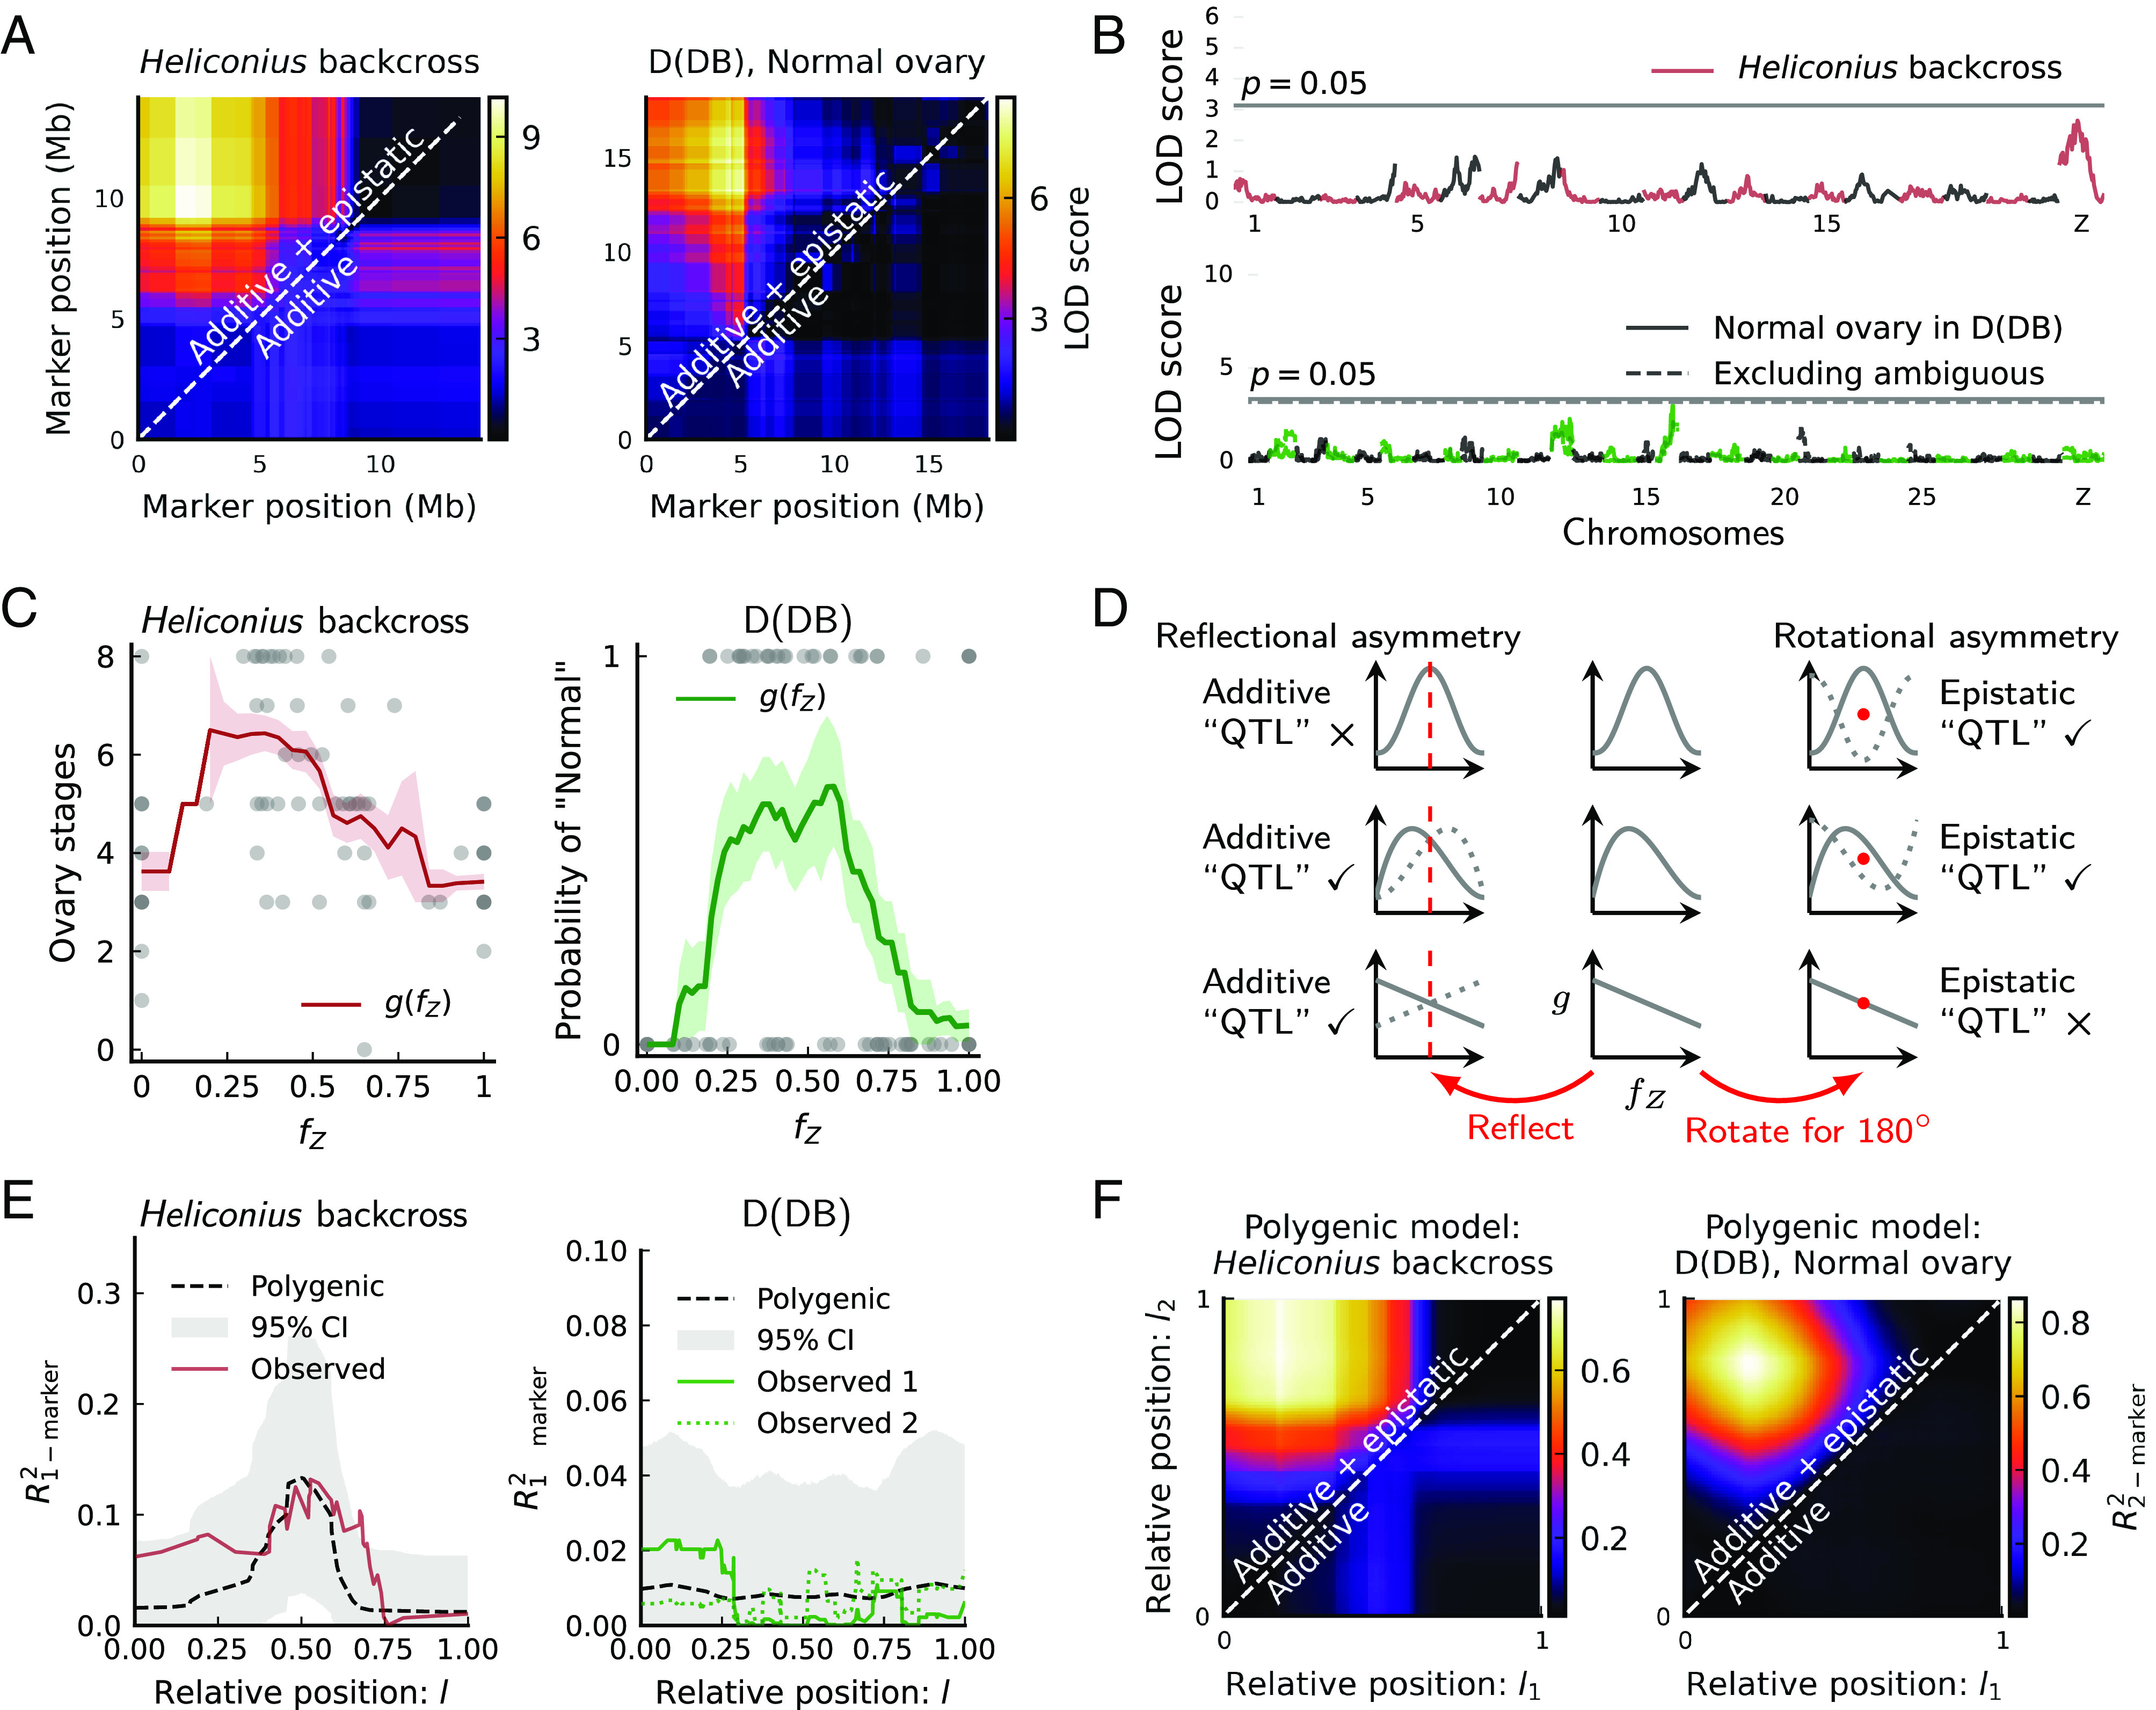
The polygenic basis of ovary dysgenesis in Heliconius backcrosses and Papilio-D(DB) females. (A) Two-marker scans identify epistasis between the Z chromosome ends. (B) One-marker scans identify a weak additive QTL on the Z chromosome in Heliconius. No significant additive QTL on the Z chromosome in D(DB) females. (C) Introgressed ancestry fraction on the Z chromosome () is informative of ovary phenotype. Higher scores in Heliconius are more “normal.” The moving average of phenotype scores (window size0.2) represents . Shaded areas are means SEs. Dots in D(DB) represent one round of phenotype assignment. (D) For traits fully polygenic on a chromosome, QTL analysis in backcrosses via marker-phenotype regression reveals only the asymmetry in . The middle column shows three representative polygenic models. The dotted curves on the left are produced by reflecting each model with respect to its center line. The dotted curves on the right are produced by rotating each model with respect to its center point for 180. Asymmetry ensues when the dotted curve does not overlap fully with the original model, which produces additive and/or epistatic QTLs depending on asymmetry types. (E) Polygenic models predict the results of one-marker scans. Dashed curves and shaded areas represent the means and 95% CIs of , across 10,000 simulated backcross broods matching sample sizes ( = 86, 142). For D(DB), observed 1 classifies ambiguous individuals as “Normal,” while observed 2 classifies them as the opposite. (F) Polygenic models yield apparent epistasis in two-marker scans—compare Fig. 4A. Heatmaps show the means of across 100 simulated backcross broods matching sample sizes.