
Fig. 2.
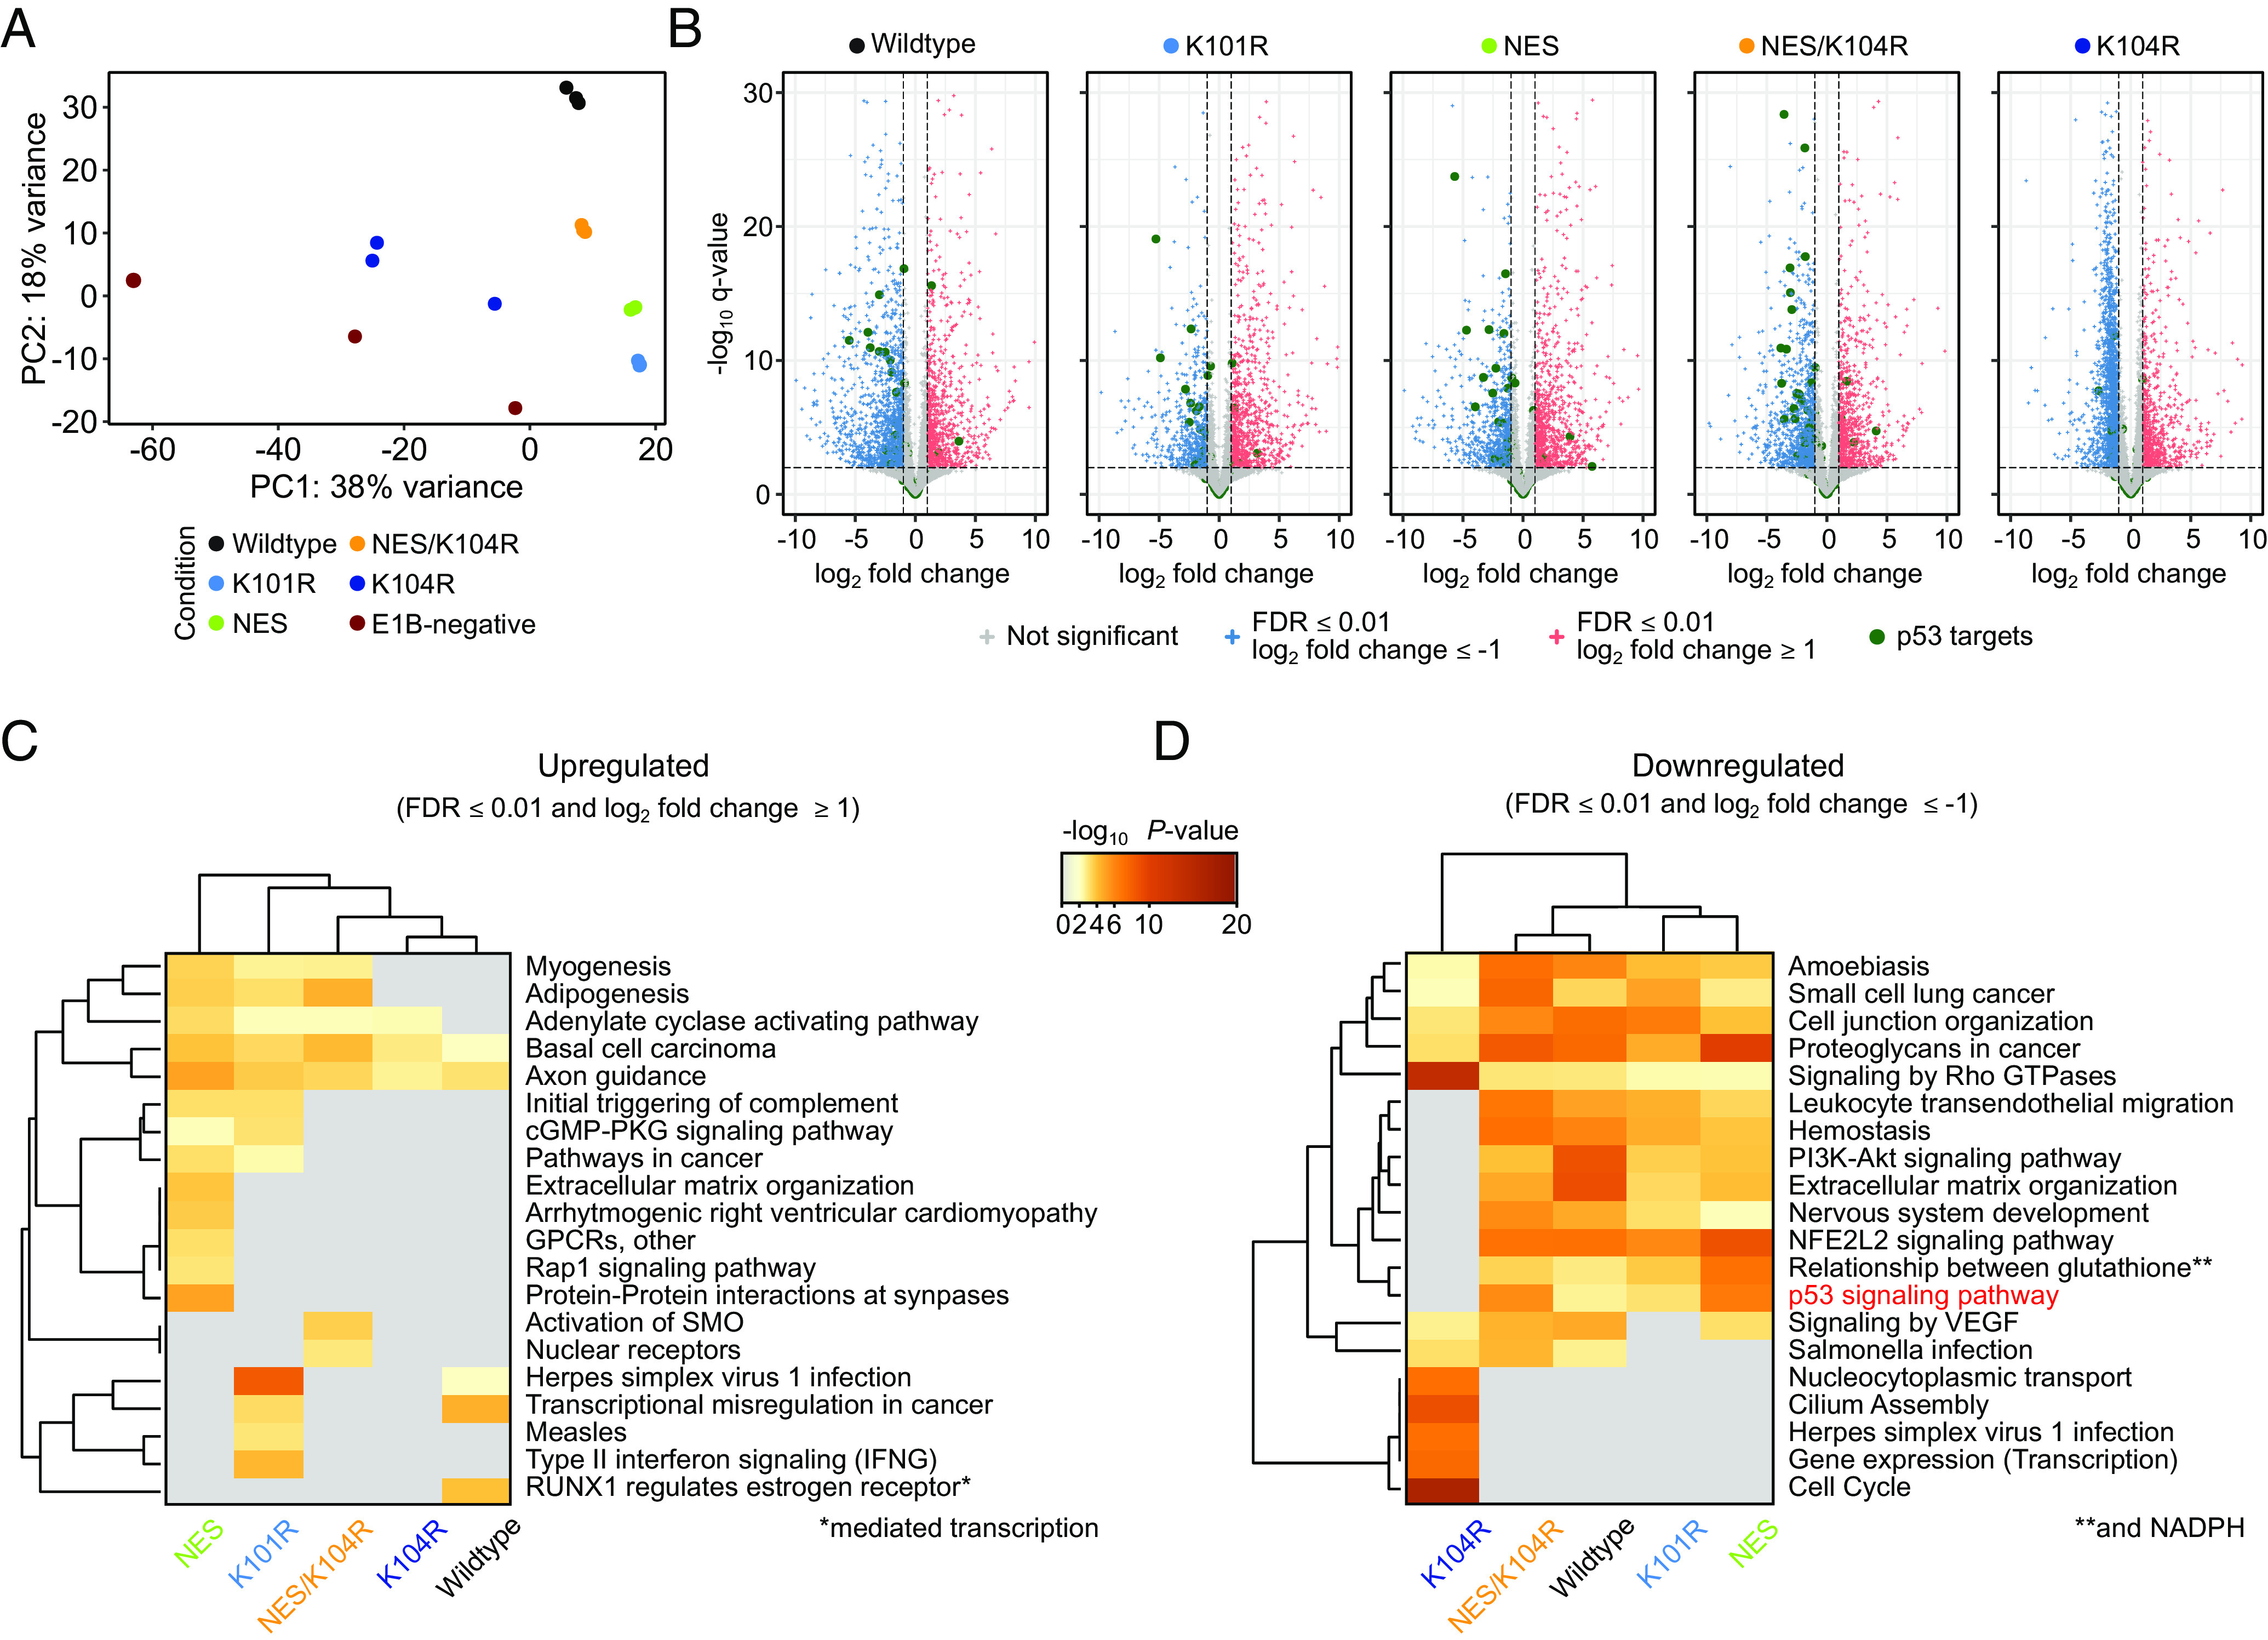
Effect of HAdV-C5 E1B-55K protein expression on the BRK cell transcriptome. (A) Principal component analysis (PCA) of transduced BRK cell RNA-seq data. “Condition” describes the individual E1B-55K protein expression cassette embedded in the lentiviral construct for the differentially expressed gene (DEG) analysis, compared to the E1B-negative control cell line. (B) Volcano plots highlighting the distribution of DEGs, induced by expression of different E1B-55Ks. Significantly upregulated (FDR ≤ 0.01 and log2 fold change ≥ 1) are colored red, while significantly downregulated (FDR ≤ 0.01 and log2 fold change ≤ –1) are colored blue. Green dots represent prominent p53 target genes curated by Fischer et al. (54) while non-significant genes are colored gray. The –log10 q-values for each gene are plotted on the y axis. The vertical and horizontal dashed lines represent the aforementioned significance cutoffs specified in the analysis. The complete list of underlying genes is provided in Dataset S4A. (C and D) Pathway analysis of the significant up- (C) or downregulated (D) genes. The heatmap plots are colored by P-values and grouped by hierarchical clustering. Here, pathways with a P-value of ≤ 0.01, a minimum count of three, and an enrichment factor of ≥ 1 are collected and grouped into clusters based on their membership similarities. The cluster term “p53 signaling pathway” is highlighted in red. Underlying data are summarized in Datasets S3A and S3B.