
Fig. 3.
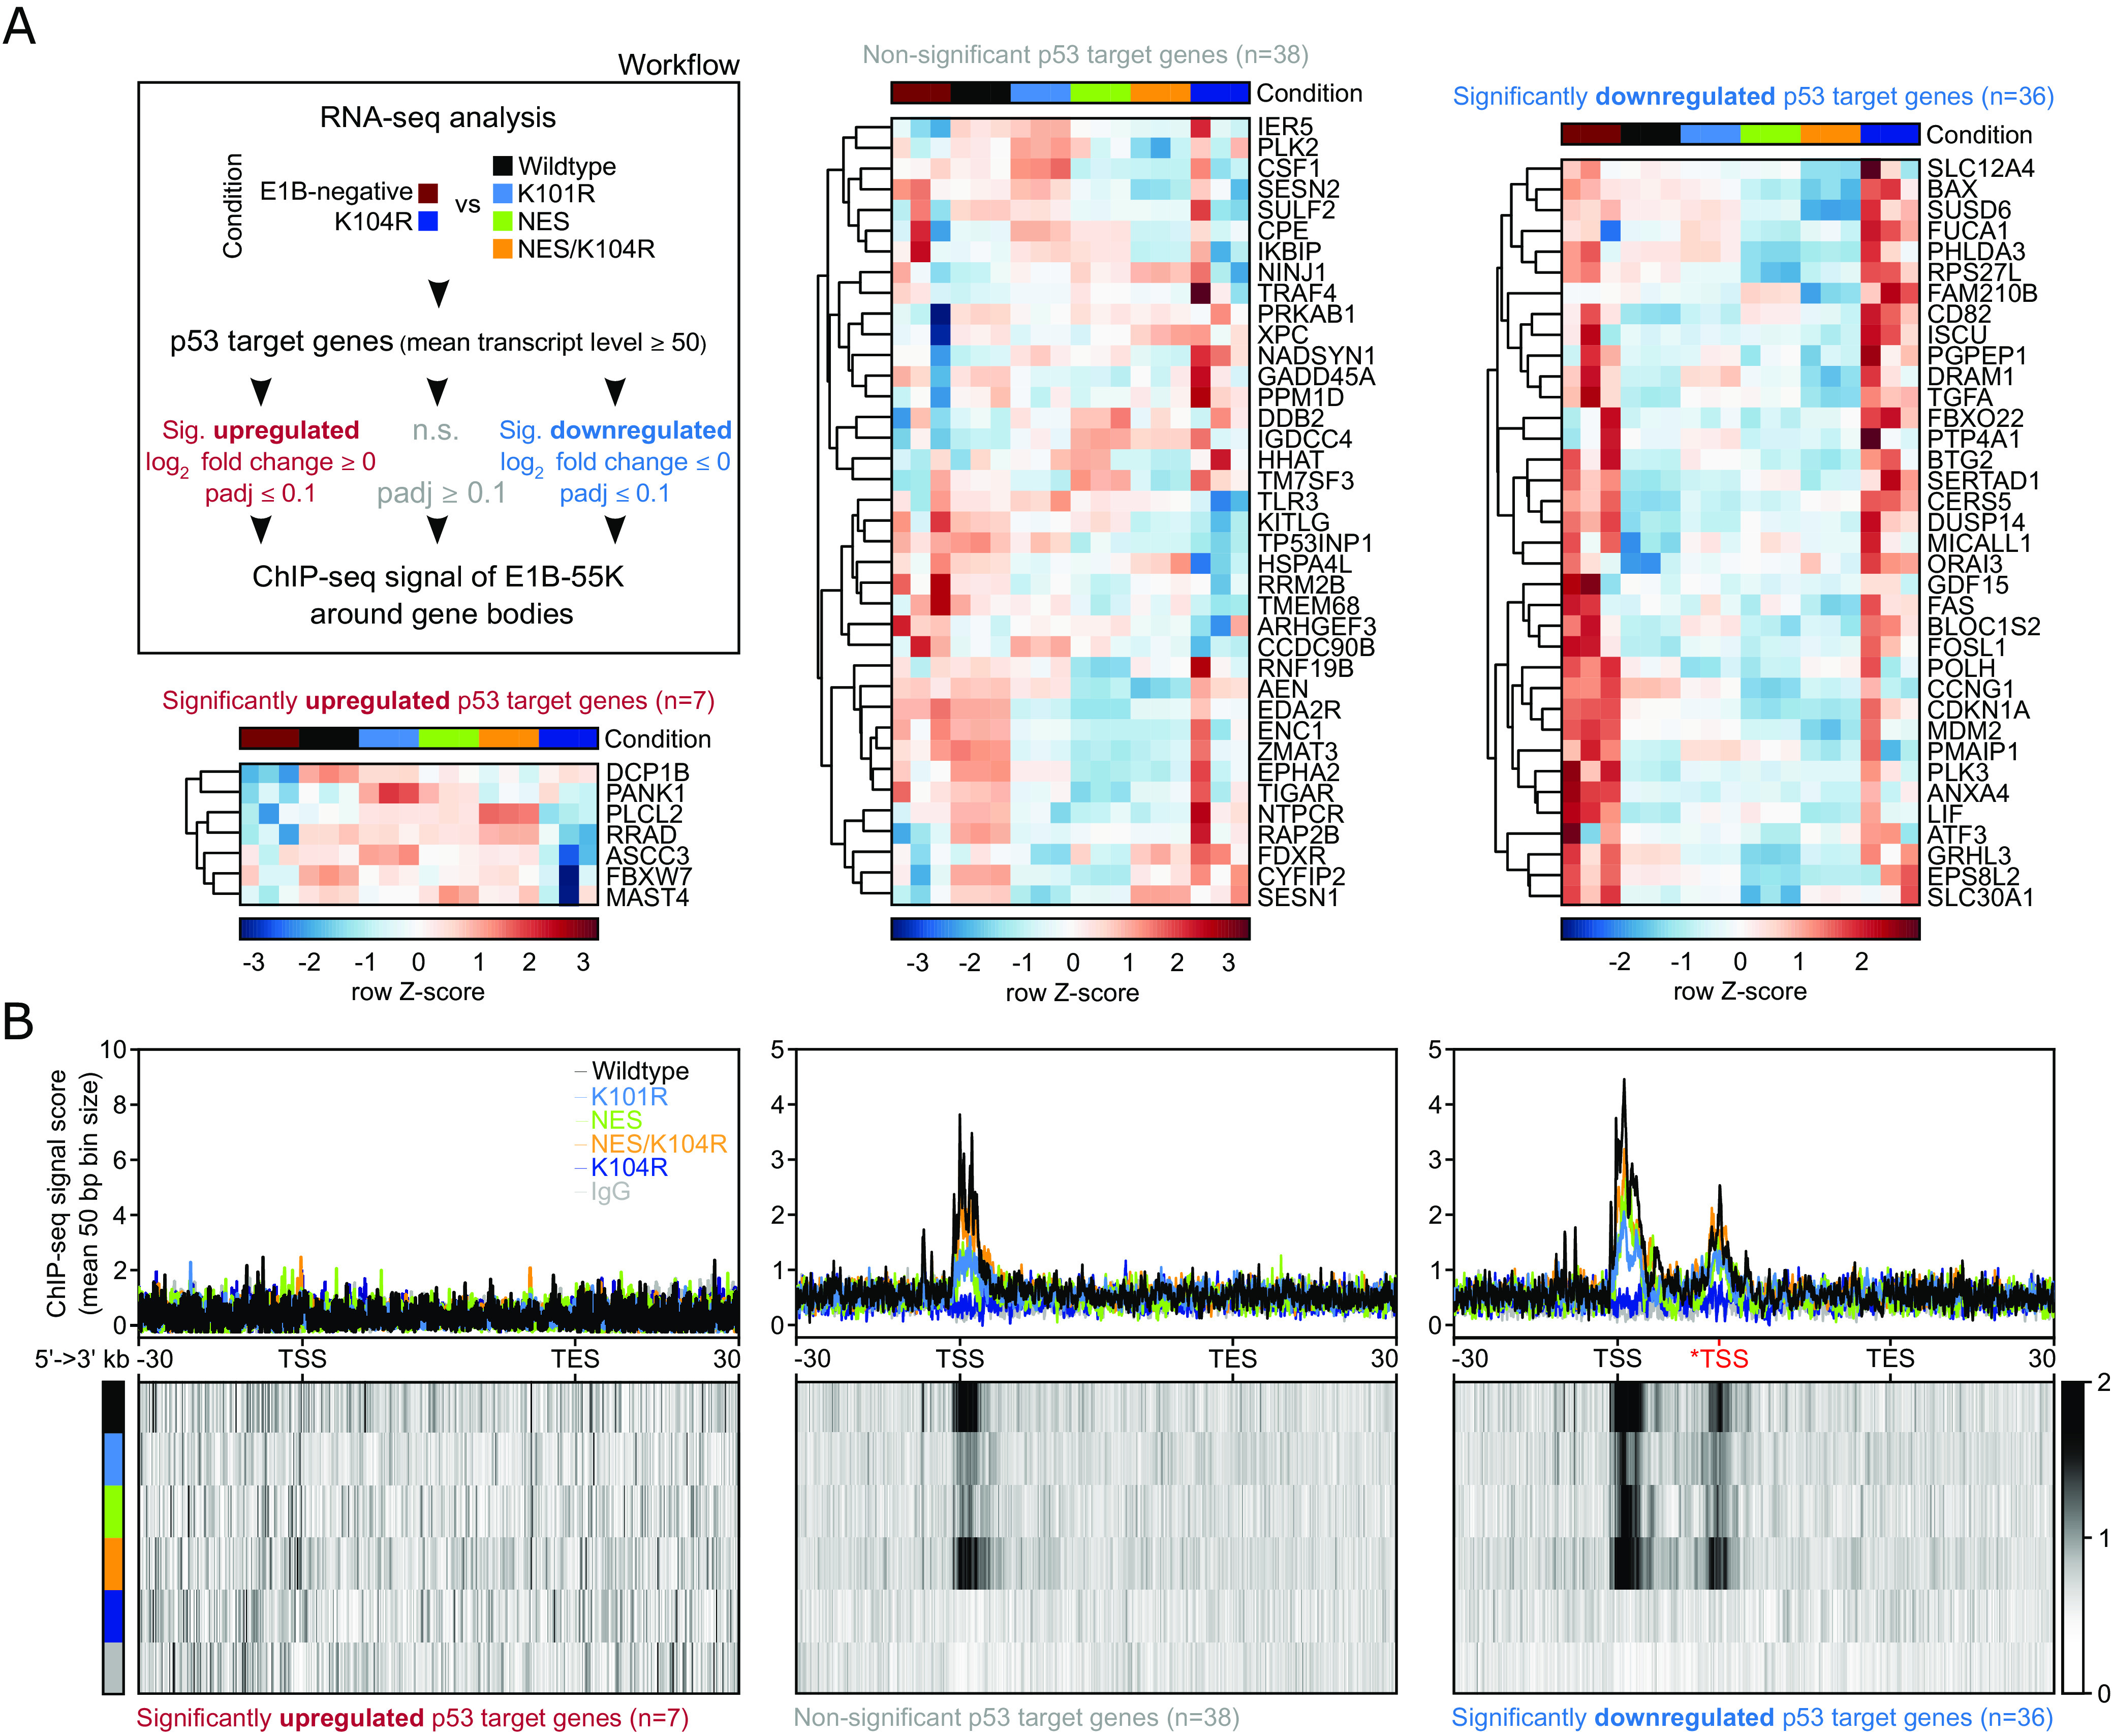
HAdV-C5 E1B-55K locates to regulatory regions of p53 target genes to directly repress their expression. (A) Workflow and heatmap of the subselection of p53 target genes, which were divided based on their respective expression level into significantly upregulated (FDR < 0.1 and log2 fold change > 0), non-significant (FDR > 0.1) or significantly downregulated (FDR < 0.1 and log2 fold change < 0) comparing the two E1B-55K conditions (indicated in the legend). Shown are the row Z-scores of normalized reads of indicated genes. We used a mean normalized transcript count of 50 reads as a cutoff to dismiss lowly expressed genes. Conditions are compared to the mean with negative (blue scores) and positive values (dark red scores) indicating fewer or more transcripts, respectively. The DEG analysis of this condition can be found in Dataset S3A (last sheet). (B) Visualized here are the gene bodies of p53 target genes from TSS to TES. The signal around the *TSS (in red) is attributed to interaction with an alternative transcriptional starting site of the CDKN1A and RPS27L genes. All gene bodies are normalized to a size of 50 kb (bin size of 50 bp) and visualized from 5′ to 3′ direction including a 30 kb up- and downstream region, showing the mean ChIP-seq signal score of E1B-55Ks via profile plots (Upper row) or heatmap plots (Lower row). The respective track is annotated in the top right corner of the first profile plot. The heatmaps visualize the profile below their respective profile plot, with the intensity of the respective signal represented by a grayscale, ranging from white (no signal) to black (strong signal). The absolute number of genes within each set is depicted below the respective heatmap plots. The genomic location of p53-targeted genes can be found in Dataset S4.