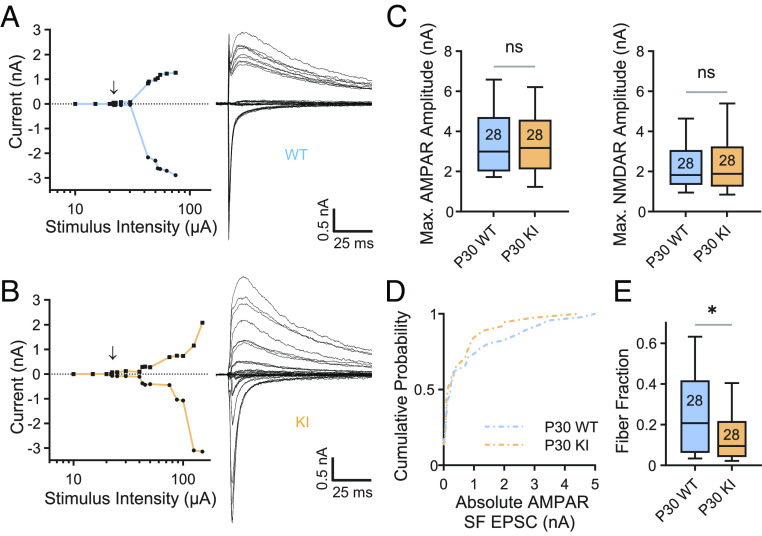
Fig. 2.
Retinogeniculate synaptic refinement is aberrant in QKI mice. (A and B) Representative example recordings from P30 WT (A) and QKI (B) relay neurons demonstrating abnormal synaptic refinement in QKI mice. Left: Plot of peak AMPAR EPSC (circles) and NMDAR (squares) plotted against stimulus intensity. The arrow indicates the emergence of the first single fiber (SF) following failures of synaptic transmission at lower stimulus intensities. Incremental increases in stimulus intensity were used to sequentially activate additional RGC axons. Right: Superimposed representative EPSCs evoked by optic tract stimulation over a range of intensities. At each stimulus intensity, recordings were performed at both −70 mV and +40 mV. Inward currents at −70 mV predominantly represent AMPAR-mediated conductances, whereas outward currents at +40 mV represent AMPAR- and NMDAR-mediated conductances. Stimulus artifacts are blanked for clarity. (C) Maximal EPSC amplitudes at −70 mV (AMPAR, Left) and +40 mV (NMDAR, Right) are not significantly different between WT and QKI mice at P30. Numbers in boxplots represent numbers of cells recorded. (D) Cumulative probability distributions of AMPAR-mediated SF amplitudes recorded at −70 mV from P30 WT and QKI mice. WT: n = 46 from six mice; KI: n = 37 from seven mice. (E) The fiber fraction (FF = SF EPSC amplitude/maximal EPSC amplitude) is significantly reduced in P30 QKI mice. *P < 0.05, two-tailed Mann–Whitney U test. Box, 25 to 75% interquartile range; line within box, median; whiskers, 10 to 90% range. WT: n = 28 from six mice; KI: n = 28 from seven mice.

