Fig. 3.
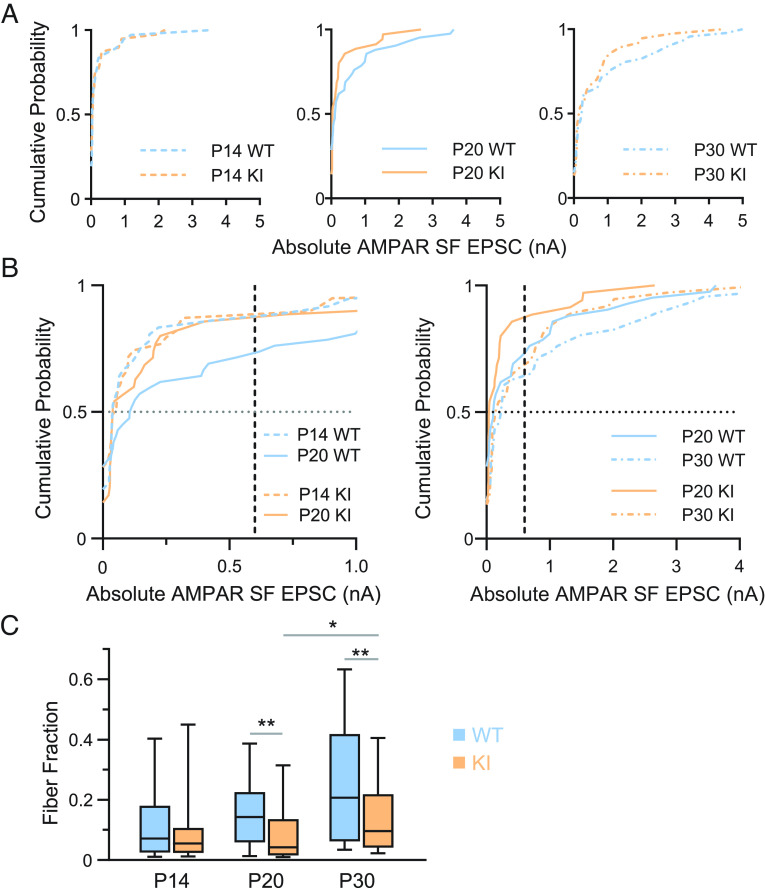
Delayed retinogeniculate refinement in QKI mice. (A) Cumulative probability distributions of AMPAR-mediated single fiber (SF) amplitudes at −70 mV for P14 (Left), P20 (Middle), and P30 (Right) QKI and WT mice. SF AMPAR EPSC amplitude distributions of WT and QKI mice overlap at P14. By P20, a subset of inputs in WT mice have strengthened, shifting the distribution to the right compared to that of QKI (WT vs. QKI: third and fourth quartiles P < 0.02; full distribution P = 0.5). By P30, the QKI distribution shifts toward that of the WT, indicating some strengthening of SF inputs in the mutant (WT vs. QKI: third and fourth quartiles P = 0.16; full distribution P = 0.64). (B) Comparison of cumulative probability distributions of AMPAR-mediated SF amplitudes (from panel A) between P14 and P20 (Left), and P20 and P30 (Right), from WT and QKI mice. The median (dotted line at y = 0.5) WT SF strengthens by 187% (0.039 at P14 to 0.11 at P20), whereas the median QKI SF slightly weakens by −27% (0.054 at P14 to 0.039 at P20). AMPAR-mediated SFs begin to strengthen from P20 to P30 in the QKI (Right), visualized by the median values at y = 0.5 in the WT (0.11 at P20 to 0.23 at P30, a 109% increase) vs. in the QKI (0.039 at P20 to 0.15 at P30, a 285% increase). Dashed lines at x = 0.6 nA highlight the greater proportion of weak RGC inputs less than 0.6 nA in the QKI relative to WT at P20. By P30, the proportion of weak RGC inputs less than 0.6 nA is relatively closer in value between QKI and WT mice. (C) The FF is not significantly different between WT and QKI mice at P14. By P20, the FF is significantly lower, indicating the presence of more RGC inputs to each relay neuron in QKI mice. While the FF of QKI mice increases significantly between P20 and P30, it does not recover to WT levels. All statistics were performed using a two-tailed Mann–Whitney U test, Kolmogorov–Smirnov, or Kruskal–Wallis when comparing more than two groups. ns, P > 0.05; *P < 0.05; **P < 0.01. P14 WT: n = 26 cells from six mice; KI: n = 26 cells from six mice. P20 WT: n = 25 cells from four mice; KI: n = 26 cells from four mice. P30 WT: n = 28 from six mice; KI: n = 28 from seven mice.

