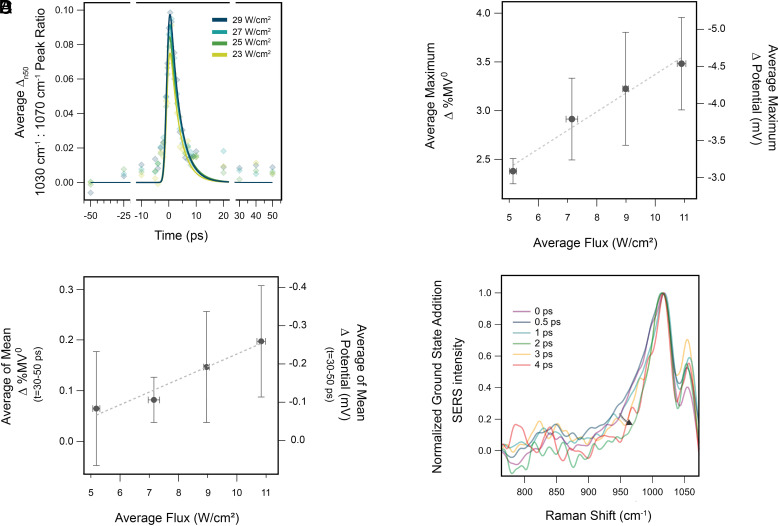
Fig. 3.
(A) Average kinetic traces of 10 ultrafast SERS experiments at 4.87 to 10.6 W/cm LSPR excitation flux. Correlation of ultrafast and SEC SERS measurements facilitates quantification of corresponding changes in %MV and electrochemical potential. These experiments lie in a linear regime for the dependence of the average maximum (B) and longer-lived (C) peak ratios on incident flux. (D) Transient signatures of excited vibrational states at 10.6-W/cm pump power.

