
Figure 1. Dose–response association of tea consumption and all-cause mortalitya in the UK Biobank.
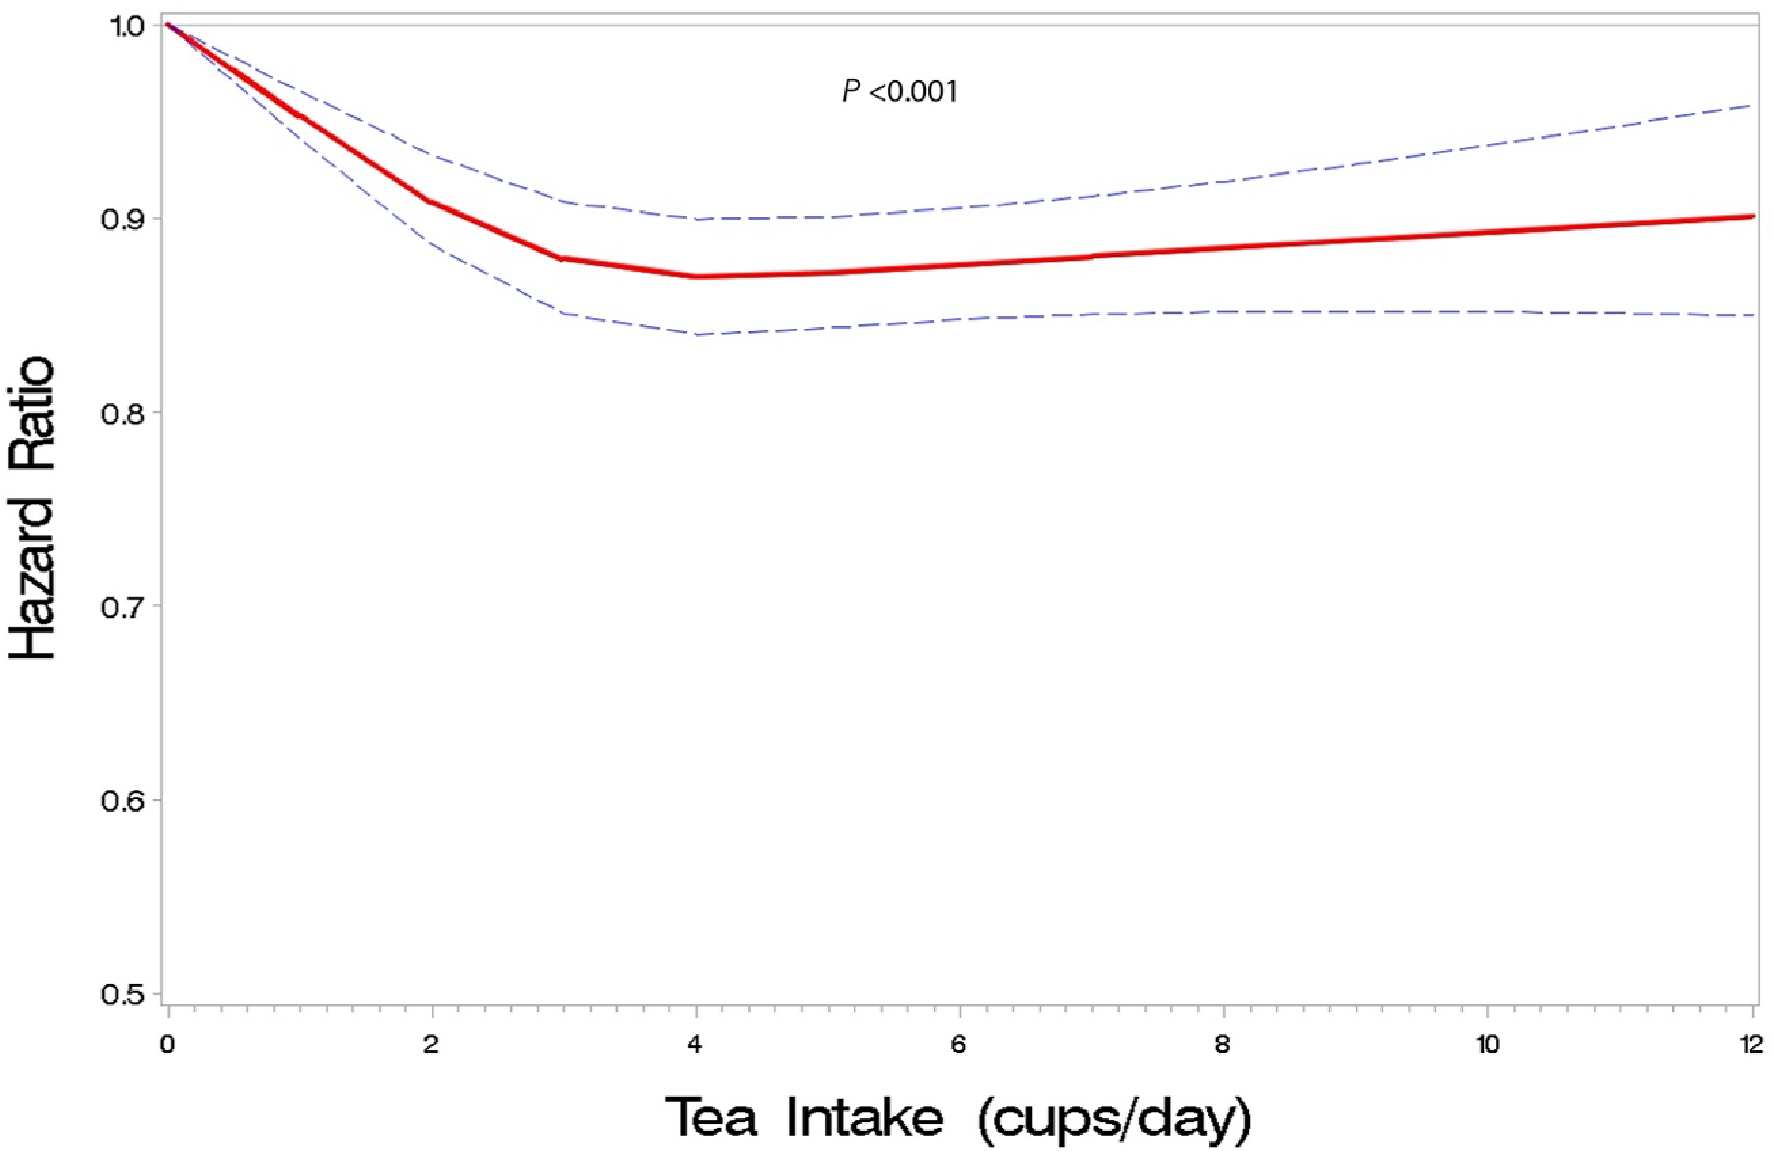
a Hazard ratio was adjusted for age; sex; race and ethnicity (White, Black, Asian, mixed, or other race), assessment center, Townsend deprivation score, general health status (excellent, good, fair, or poor), cancer (yes or no), cardiovascular disease (yes or no), diabetes (yes or no), BMI (kg/m2), tobacco smoking (25-level variable including current smoking status, smoking intensity [current and former smokers], time since quitting [former smokers], and cigar and pipe use [current and former smokers]); physical activity (>10 minutes of moderate or vigorous activity; days per week); alcohol intake (never drinker, former drinker, infrequent drinker [<1 drink per week], occasional drinker [>1 drink per week but <1 drink per day], moderate daily drinker [1 to 3 drinks per day]), or heavy drinker [>3 drinks per day]; coffee intake (cups per day); and dietary intake including vegetables (tablespoons per day), fruits (pieces per day), red meat (beef, lamb, and pork; 0 to 1, 1.5, 2, 2.5, 3 to 21 times per week), and processed meat (0, <1, 1, 2 to 4, 5 to 6, and ≥7 times per week).