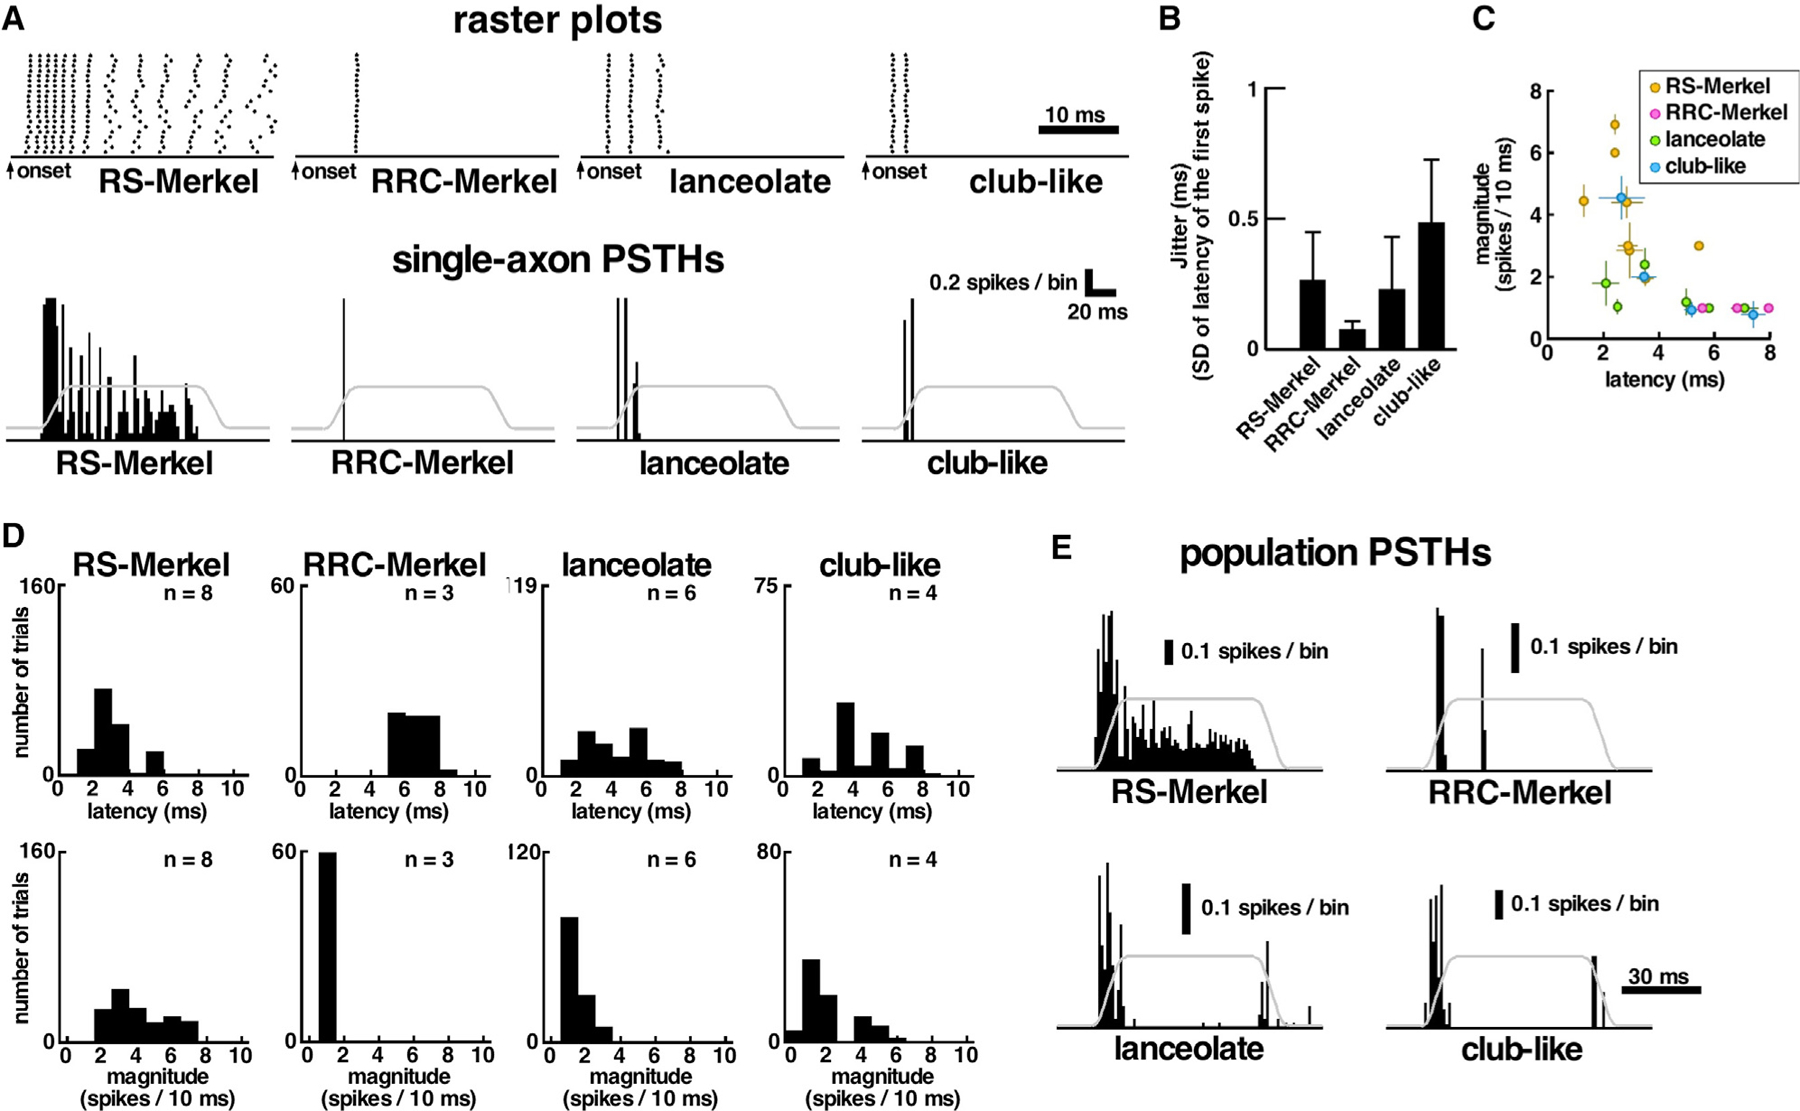
Figure 2. Response Properties of Primary Afferents to Whisker Deflection in the Afferent’s Best Direction.

All histograms use bin width = 1 ms; error bars in (B) and (C) indicate standard deviations.
(A) Representative raster plots (20 trials) and post-stimulus time histograms (PSTHs) for each mechanoreceptor type. Gray lines represent piezoelectric stimulator motion (5° amplitude). ON/(OFF) responses were defined to occur during the 10-ms onset/(offset) ramp.
(B) For each receptor type, spike timing variability is quantified as the standard deviation of the latency to first spike across 20 trials. Error bars indicate SD across all afferents in each type.
(C) Inverse relationship between onset latency (ON responses) and spiking magnitude for each recorded afferent. Error bars indicate SD across 20 trials in each afferent.
(D) Histograms of ON latencies and ON magnitudes for all trials from all afferents, categorized by afferent type. n, number of afferents.
(E) Population PSTHs constructed by averaging all best-direction responses for all endings of the same type.
See also Figure S2.
